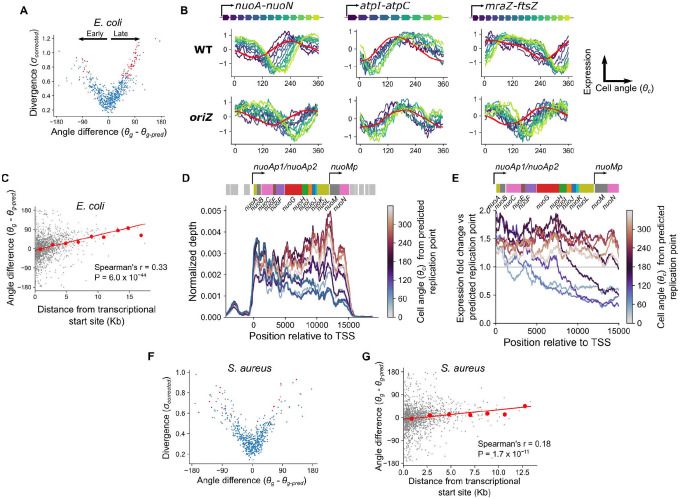
Figure 4: A gene’s position within its operon produces a characteristic delay in expression dynamics in E. coli but not S. aureus.
A) Plot of divergence from predictions against the difference between predicted and observed angles in E. coli, with divergent genes in red. Angle difference therefore represents whether a gene is expressed earlier or later than expected, as indicated by the black arrows. B) Cell cycle expression plots for operons showing “delayed” genes as in Fig. 3A & C but colored by position within the operon. Model-predicted expression is represented in red. Shown for WT and the oriZ mutant. C) Plot of maximum distance from a transcriptional start site against difference between predicted and observed angles in E. coli. Red line indicates the linear model fit and red points indicate averages of 2 kb bins. D) Normalized per-base read depth at the nuo operon locus for cells averaged in 10 bins by cell angle, θc. Traces are smoothed by a 1 kb centered rolling mean and colored by mean cell angle relative to the predicted timing of gene replication (see Materials & Methods). The nuo operon structure is indicated by the schematic above, with the surrounding genes in grey. E) Per-base read depth as shown in (D) for the nuo operon, but with expression shown as fold-change relative to expression at the predicted time of gene replication. F) Plot of divergence from predictions against the difference between predicted and observed angles, as in (A) but for S. aureus. G) Plot of maximum distance from a transcriptional start site against difference between predicted and observed angles, as in (B) but for S. aureus.

