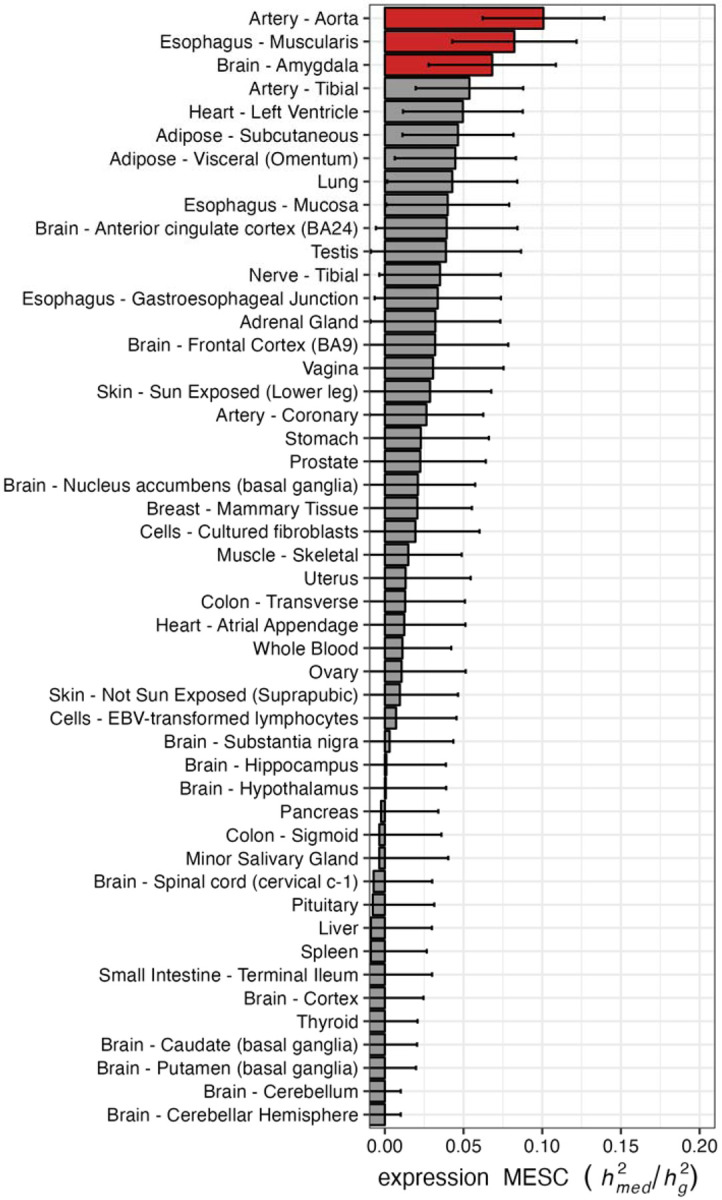
Figure 2. Proportion of heritability mediated by gene expression levels.

The bar plots correspond the estimated expression MESC () in each tissue panel in GTEx v8. Each error bar indicates jackknife standard errors. The red color represents significant tissue panels (P-value < 0.05).
