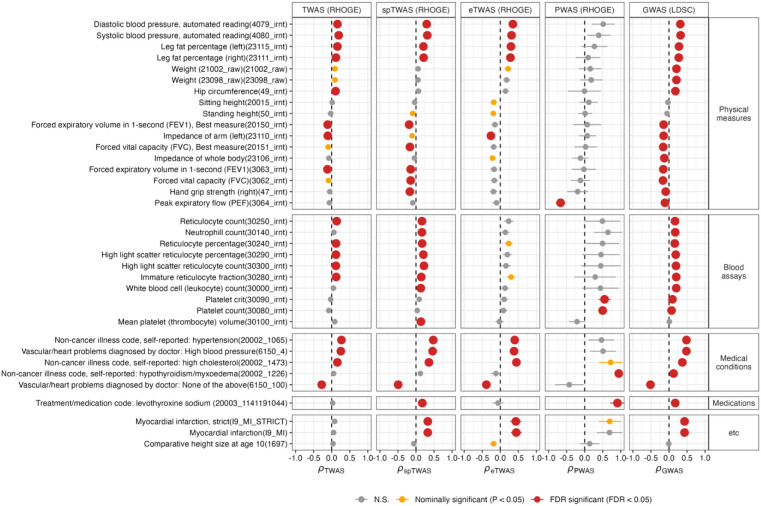
Figure 3. Genetic correlation between IS and UKBB phenotypes.
Each point indicates a genetic correlation with standard errors from TWAS/spTWAS/eTWAS/PWAS. Significance levels are represented by red or orange color. We use the following abbreviations ρTWAS, transcriptomic correlation analysis using TWAS; ρspTWAS, transcriptomic correlation analysis using spTWAS; ρeTWAS, transcriptomic correlation analysis using eTWAS; ρPWAS, proteomic correlation analysis using PWAS; ρGWAS, genomic correlation analysis using GWAS. In the figure, we show results indicating significance in at least one TWAS/spTWAS/eTWAS/PWAS analysis.

