
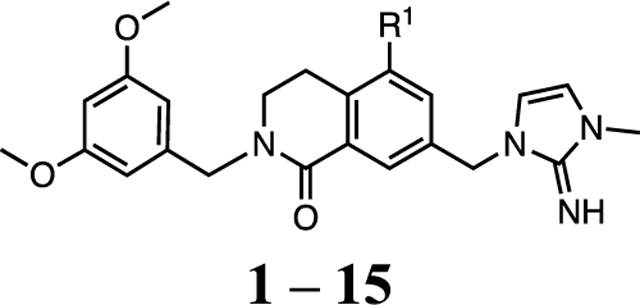
Table 1.
SAR Profile of P4 Imidazole-Imine Series
| |||||||
|---|---|---|---|---|---|---|---|
|
| |||||||
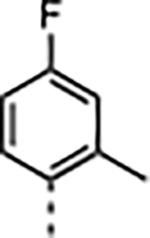
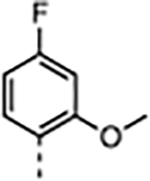
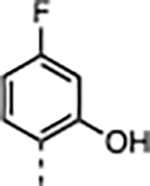
| compnd | R1 = | cLogP |
Ki (nM) TR-FRETa |
Cell Proliferation Assays GI50(nM)a |
Selectivityb |
||
| WDR5 | MV4:11 | MOLM-13 | K562 | K562/MV4:11 | |||
|
| |||||||
| 1 c |
|
4.8 | <0.02 | 38 ± 9.0 | 78 ± 13 | 8000 ± 4100 | 210 |
| 2 |
|
4.0 | 0.033 ± 0.005 | 210 ± 19 | 420 ± 30 | 18000 ± 2800 | 86 |
| 3 |
|
3.7 | 0.035 ± 0.005 | 88 ± 20 | 220 ± 23 | >30000 | >340 |
| 4 |
|
3.2 | 0.036 ± 0.005 | 1200 ± 310 | 3900 ± 410 | >30000 | >25 |
| 5 |
|
2.7 | 0.055 ± 0.005 | 560 ± 84 | 1600 ± 200 | >30000 | >54 |
| 6 |
|
3.7 | 0.022 ± 0.001 | 640 ± 120 | 2400 ± 240 | >30000 | >47 |
| 7 |
|
3.9 | <0.02 | 120 ± 59 | 290 ± 170 | >29000 | >240 |
| 8 |
|
3.2 | 0.029 ± 0.002 | 230 ± 52 | 640 ± 120 | >30000 | >130 |
| 9 |
|
3.7 | <0.02 | 200 ± 52 | 560 ± 76 | >30000 | >150 |
| 10 |
|
2.4 | 0.046 ± 0.002 | 850 ± 240 | 2100 ± 410 | >30000 | >35 |
| 11 |
|
2.6 | 0.023 ± 0.001 | 210 ± 49 | 570 ± 85 | >30000 | >140 |
| 12 |
|
2.5 | 0.21 ± 0.008 | 19000 ± 3000 | >30000 | >30000 | >2 |
| 13 |
|
3.1 | 0.025 ± 0.003 | 85 ± 17 | 270 ± 31 | >30000 | >350 |
| 14 |
|
3.5 | <0.02 | 39 ± 9.0 | 110 ± 7.8 | >30000 | >770 |
| 15 |
|
4.0 | <0.02 | 36 ± 11 | 110 ± 9.8 | >30000 | >830 |
a
TR-FRET Ki, and cell proliferation GI50 values represent four independent replicate determinations ± standard deviation.
b
Selectivity is defined a GI50,K562/GI50,MV4:11 and is used to generally distinguish between on- and off-target inhibition mechanisms.
c
The data for 1 were reported in our previous report.35