
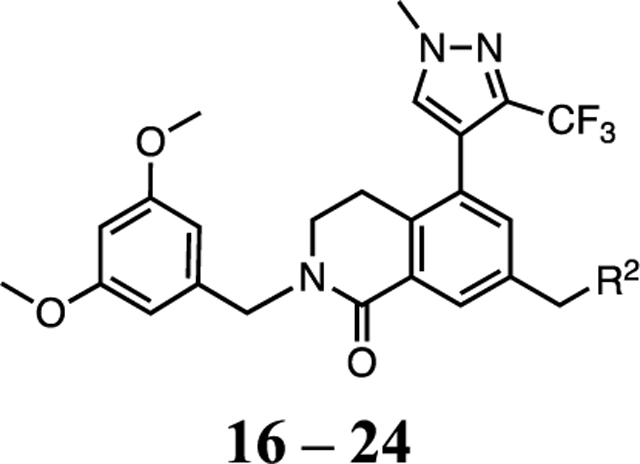
Table 2.
SAR Profile of Nonbasic Warhead Series
| |||||||
|---|---|---|---|---|---|---|---|
|
| |||||||
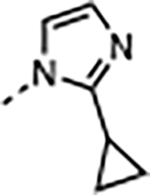
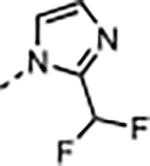
| compnd | R2 = | cLogP |
Ki (nM) TR-FRETa |
Cell Proliferation Assays GI50 (nM)a |
Selectivityb |
||
| WDR5 | MV4:11 | MOLM-13 | K562 | K562/MV4:11 | |||
|
| |||||||
| 16 |
|
2.9 | <0.02 | 59 ± 5.6 | 180 ± 51 | 9100 ± 2100 | 150 |
| 17 |
|
3.9 | >6.7 | 22000 ± 6000 | 20000 ± 5400 | >30000 | >1 |
| 18 |
|
4.4 | >6.7 | 15000 ± 4000 | 15000 ± 3600 | >30000 | >2 |
| 19 |
|
1.6 | 6.5 ± 1.7 | 16000 ± 1300 | >30000 | >30000 | >2 |
| 20 |
|
3.1 | <0.02 | 32 ± 13 | 110 ± 33 | 3700 ± 2500 | 120 |
| 21 |
|
3.7 | 0.022 ± 0.001 | 94 ± 10 | 240 ± 53 | 7500 ± 1300 | 80 |
| 22 |
|
4.1 | 3.4 ± 0.17 | 4700 ± 500 | 7700 ± 2000 | 16000 ± 3100 | 3 |
| 23 |
|
3.6 | 0.028 ± 0.002 | 240 ± 64 | 710 ± 140 | 8500 ± 2000 | 35 |
| 24 |
|
3.1 | >6.7 | 12000 ± 2800 | 20000 ± 4900 | >30000 | >3 |
a
TR-FRET Ki and cell proliferation GI50 values represent four independent replicate determinations ± standard deviation.
b
Selectivity is defined as GI50,K562/GI50,MV4:11 and is used to generally distinguish between on- and off-target inhibition mechanisms.