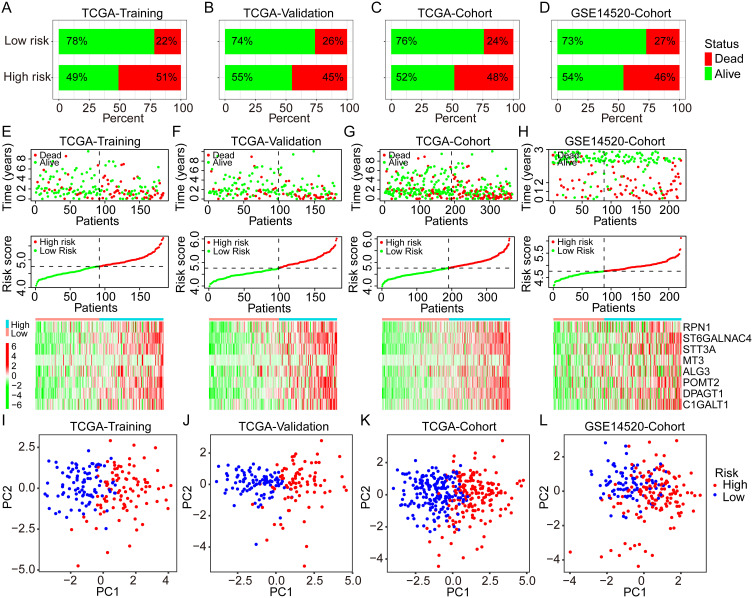
Figure 3.
Distribution of the risk score, survival status, and GRGs expression in different cohorts. (A–D) Percentages of different survival status in high- and low-risk patients in the TCGA training group, the TCGA validation group, the TCGA overall cohort, and the GSE14520 cohort. (E–H) Distribution of the risk score, survival status, and GRGs’ expression in the TCGA training group, the TCGA validation group, the TCGA overall cohort, and the GSE14520 cohort. (I–L) PCA analysis for the distribution of high- and low-risk patients in the TCGA training group, the TCGA validation group, the TCGA overall cohort, and the GSE14520 cohort.
Abbreviations: PCA, principal component analysis; GRGs, glycosylation-related genes; HCC, hepatocellular carcinoma; TCGA, the Cancer Genome Atlas.

