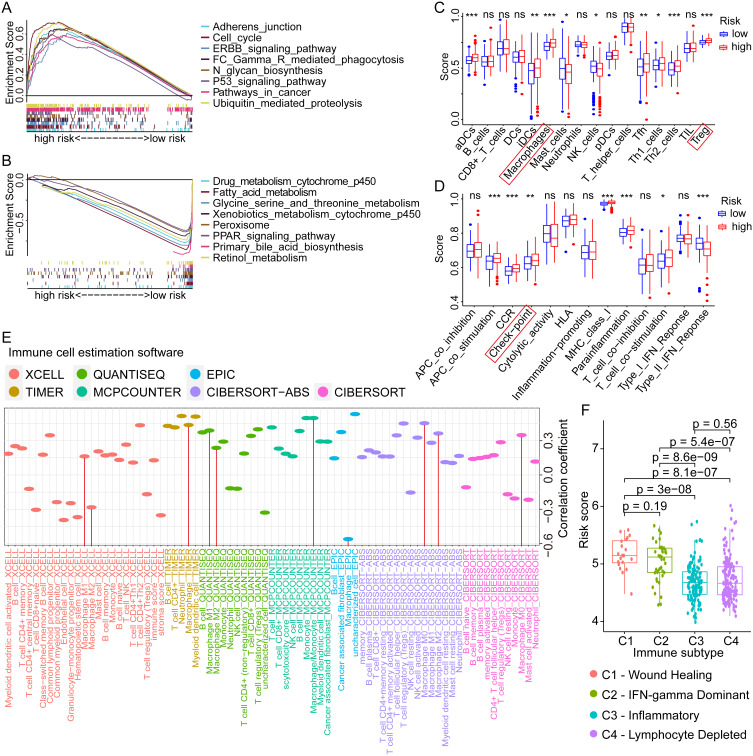
Figure 6.
GSEA, ssGSEA, and immunological correlation analyses of different risk scores in HCC. (A and B) Enriched pathways in high- and low-risk groups of HCC by GSEA analysis. (C and D) Differential analyses of the immune status and function in high- and low-risk groups by ssGSEA analysis. (E) Correlation analyses between the risk scores and the infiltration levels of various immune cells in HCC. (F) The distribution of risk scores in different immune subtypes of HCC. ns not significant, *p < 0.05, **p < 0.01, ***p < 0.001.
Abbreviations: GSEA, gene set enrichment analysis; ssGSEA, Single-sample GSEA; HCC, hepatocellular carcinoma.

