
Figure 6. Results of a single simulation of a bootstrapped-based sequential probability ratio test (bSPRT) of a regression coefficient.
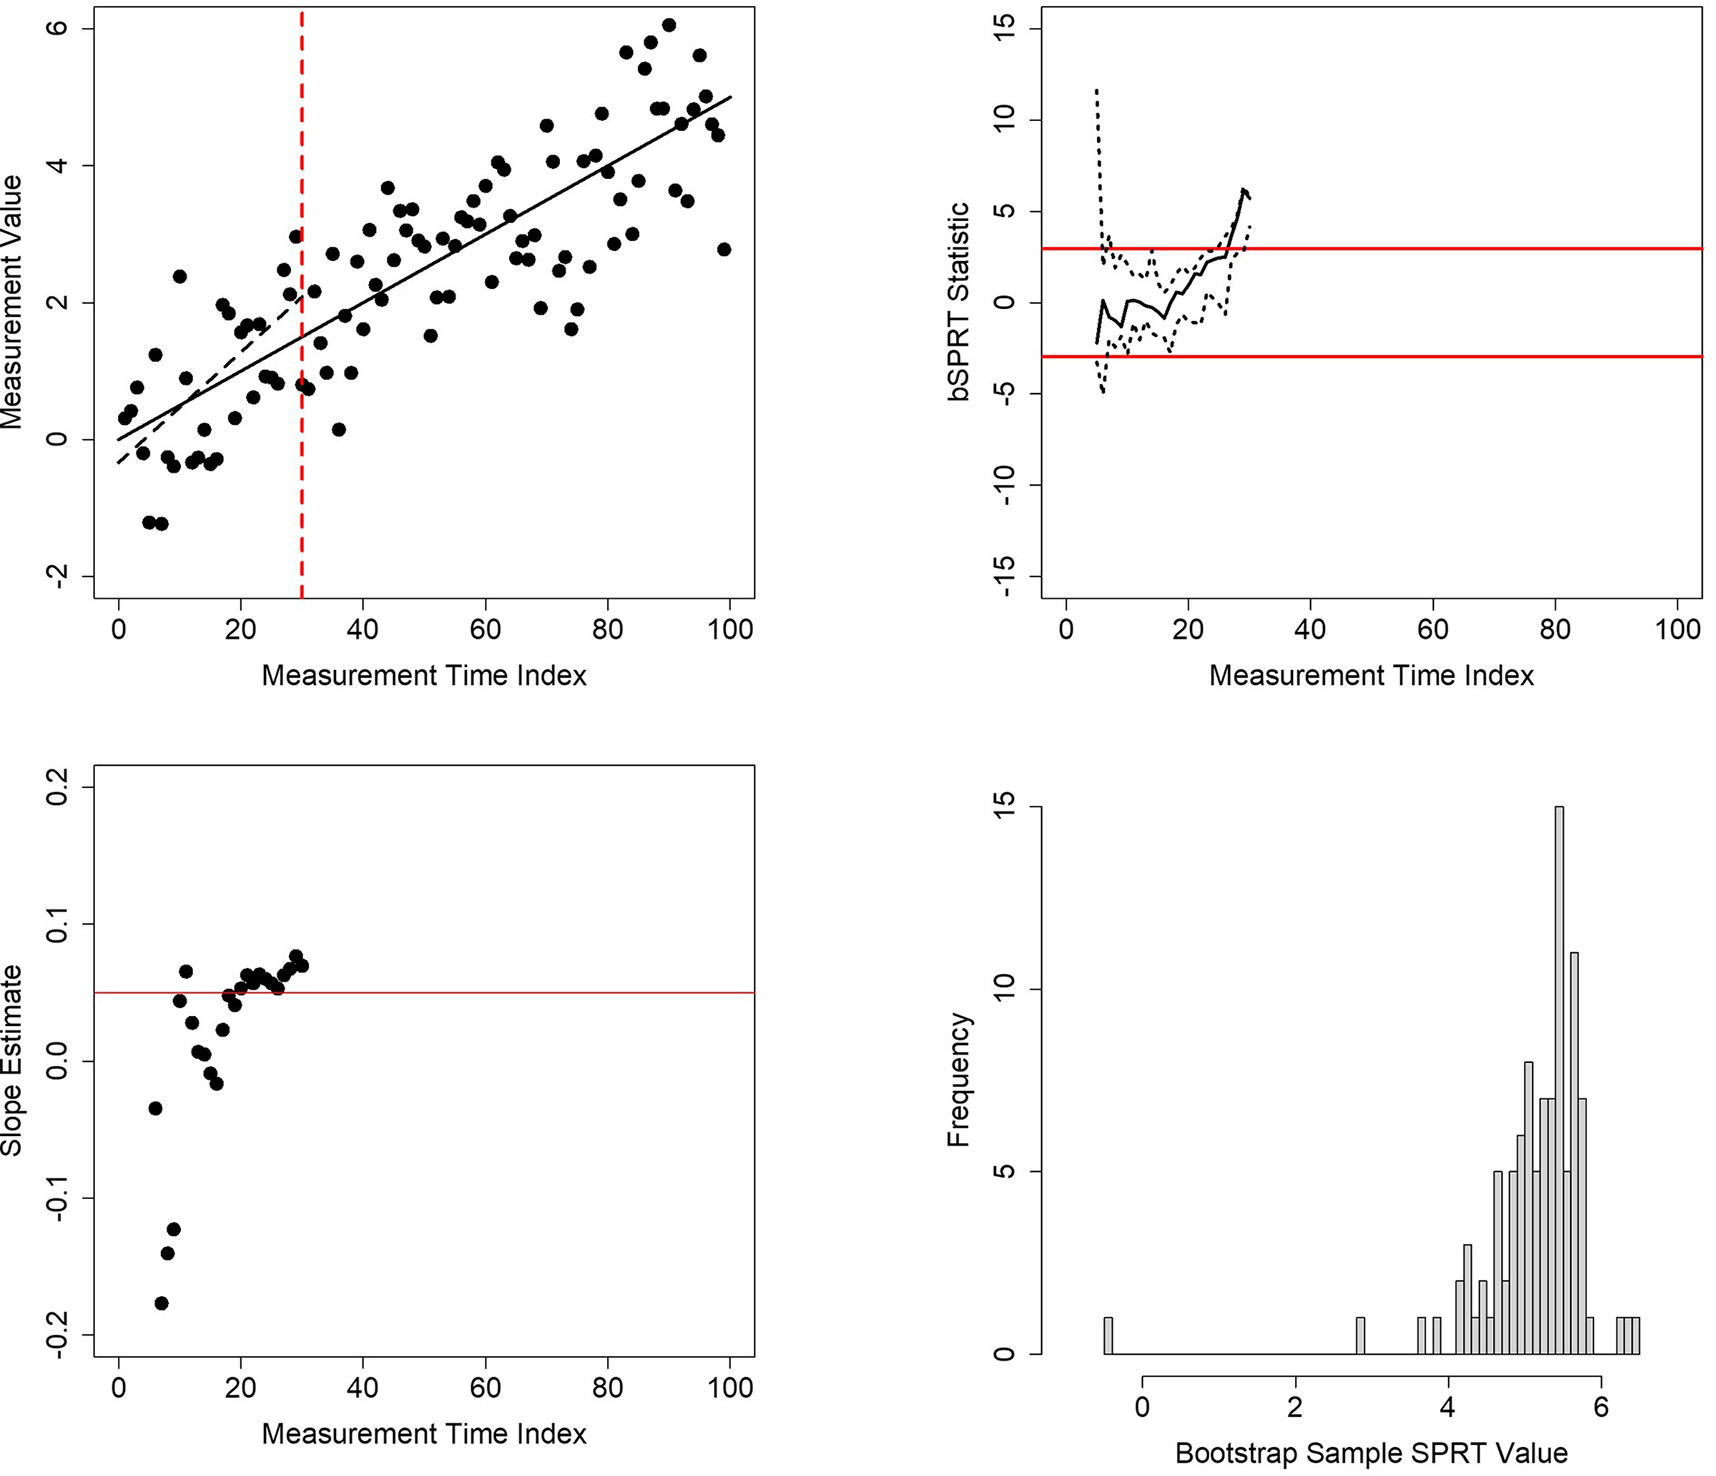
Upper left panel: 100 simulated measurement values plotted against time of collection. The solid black line is the known regression relationship between the values and time. The dashed black line is the estimated regression relationship for the first 31 observations. The vertical red dashed line is the time at which evidence for the slope of the regression between the values and time reached statistical significance (i.e., time 31). Upper right panel: the behavior of the SPRT statistic evaluating the hypothesis that the slope computed from a regression analysis of the numbers in the upper left panel is not equal to zero (black line) and its 95% confidence limits (dashed black lines). The red lines give the crossing boundaries for significance at a type I error rate of 0.05. Lower left panel: estimate of the slope after each successive measurement until time 31. Lower right panel: distribution of the SPRT statistic based on 100 bootstrap samples at time 31.