
FIGURE 1.
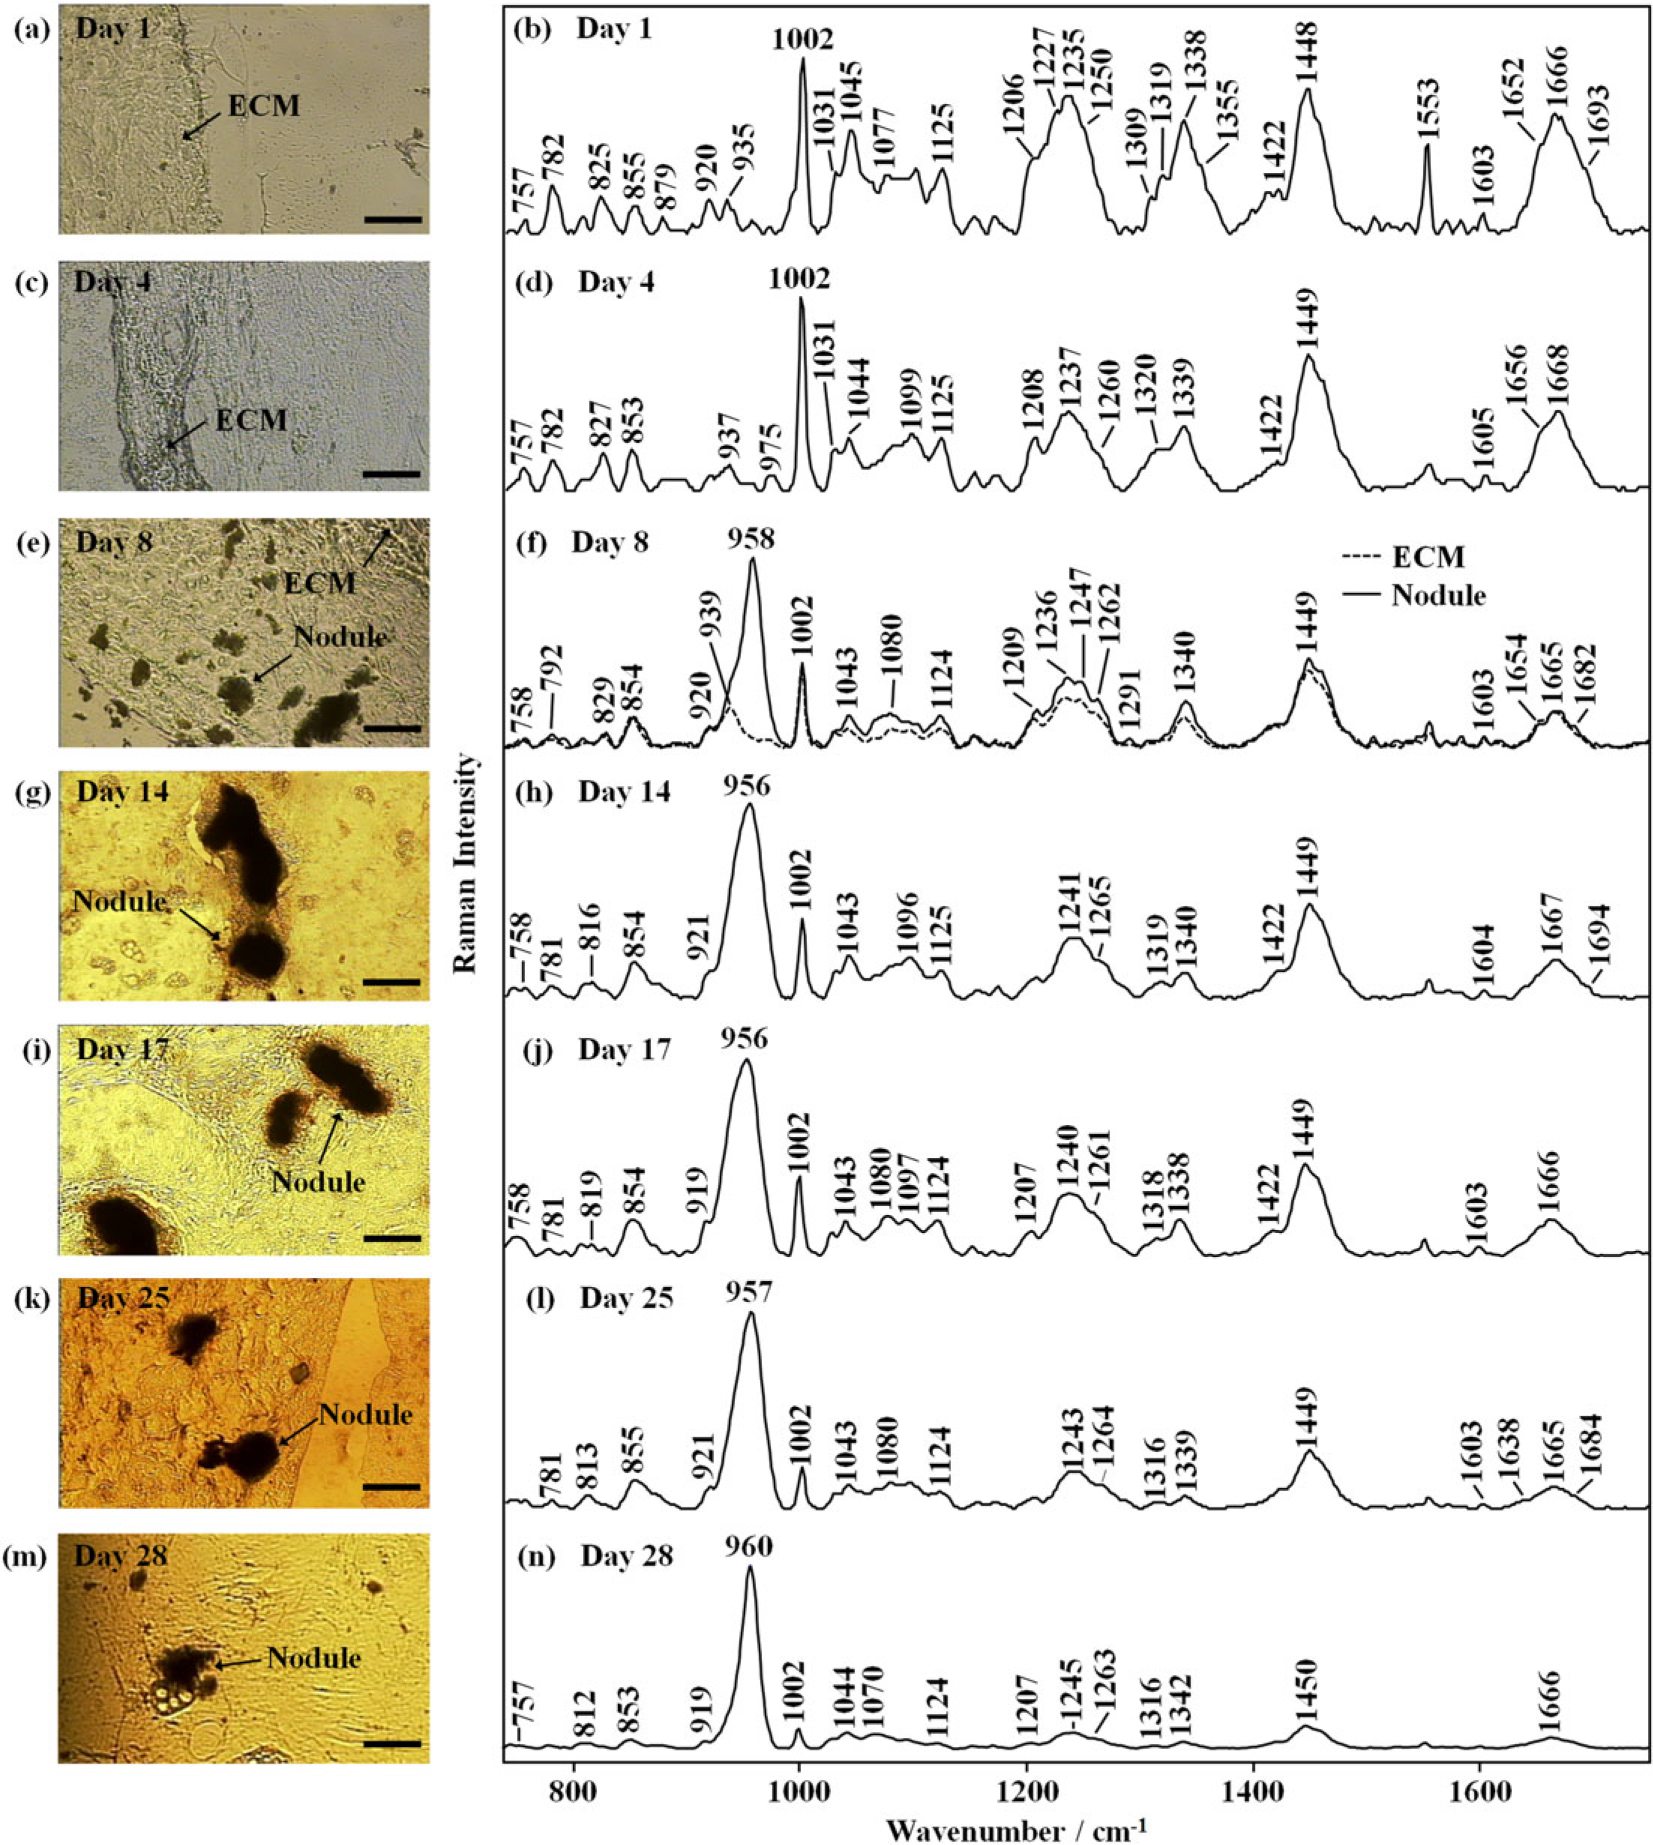
Select von Kossa-stained images with corresponding site-matched Raman spectra (see arrows) acquired at select cell culture days. (a, b) Day 1; (c, d) Day 4; (e, f) Day 8; (g, h) Day 14; (i, j) Day 17; (k, l) Day 25; and (m, n) Day 28. Scale bar: 200 μm