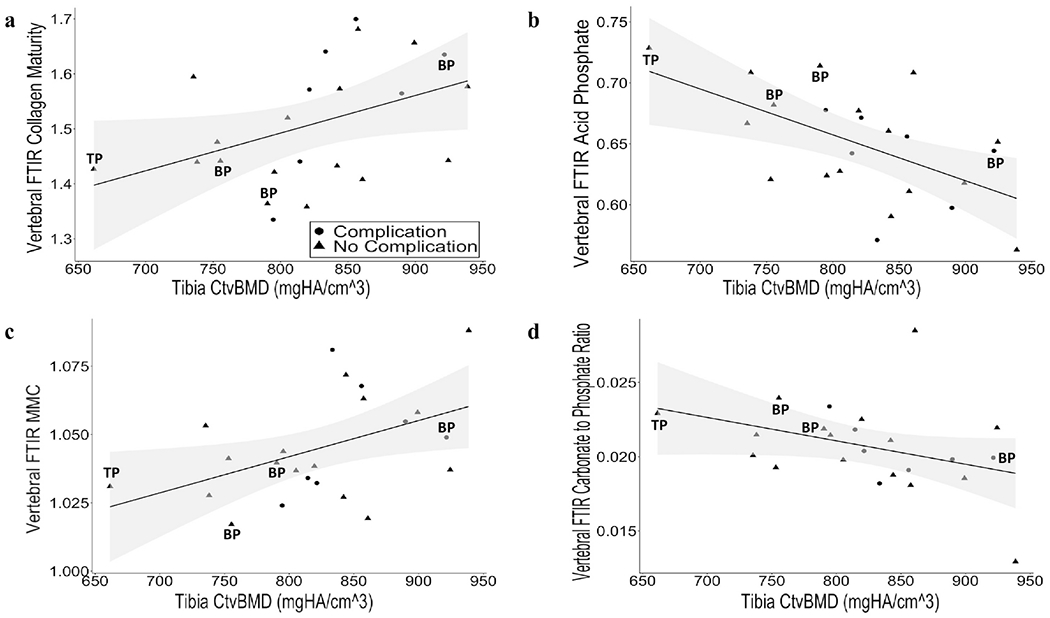
Figure 2.

Association between FTIR metrics and cortical vBMD at the tibia by HRpQCT. Correlation between Ct vBMD at the tibia, measured by HRpQCT with (a) collagen maturity (r = 0.45, p = 0.032), (b) acid phosphate content (r = −0.55, p = 0.0073), (c) mineral maturity/crystallinity (MMC) (r = 0.45, p = 0.034), and (d) carbonate to phosphate ratio (r = −0.42, p = 0.049). Shaded area represents the 95% confidence interval. Patients currently using bisphosphonates (BP) and teriparatide (TP) are indicated. Patients who developed post-operative complications are denoted by circles, and patients who did not develop complications are denoted by triangles.
