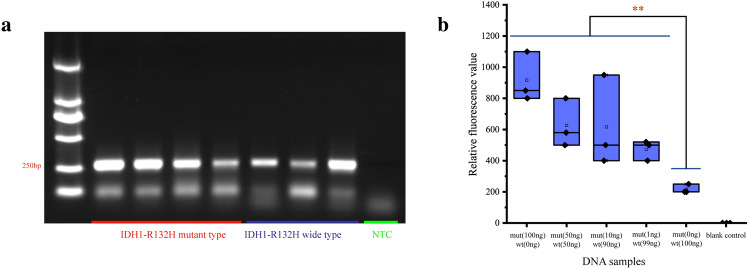
Figure 3.
Validation of the Crispr-Cas12a fluorescence detection system. (a) Identification of the target gene amplification products by electrophoresis. The belts of IDH1-wt (the first four belts) and IDH1-R132H (the latter four belts) of electrophoresis with the length of 262 bp. (b) Verification of fluorescence system. Non-amplified IDH1-wt and IDH1-R132H were mixed in different proportions to simulate the IDH1-R132H at 100%, 50%, 50%, 10%, 1% and 0 frequencies in vivo, respectively. Using Crispr-Cas12a to perform the test for 3 times, the relative fluorescence value was positively correlated with the IDH mutation frequency range with qualitative detection power, and the lowest detectable mutation frequency was 1% theoretically (link: https://www.adobe.com/products/illustrator.html/, version 24.0.1).

