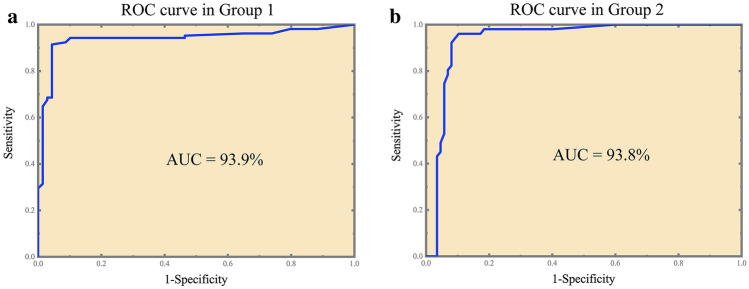
Figure 4.
ROC curve of Crispr method. (a) ROC curve in Group 1. The value of AUC was 0.939 (95% CI 0.900–0.975); the threshold of relative fluorescence value was 425; the sensitivity, specificity and consistency rate was 91.4%, 95.7% and 93.1%, respectively. (b) ROC curve in Group 2. The value of AUC was 0.938 (95% CI 0.893–0.983); the threshold of relative fluorescence value was 525; the sensitivity, specificity and consistency rate was 96.1%, 89.7% and 92.0%, respectively (link: https://www.originlab.com/, version OriginPro 2018C).

