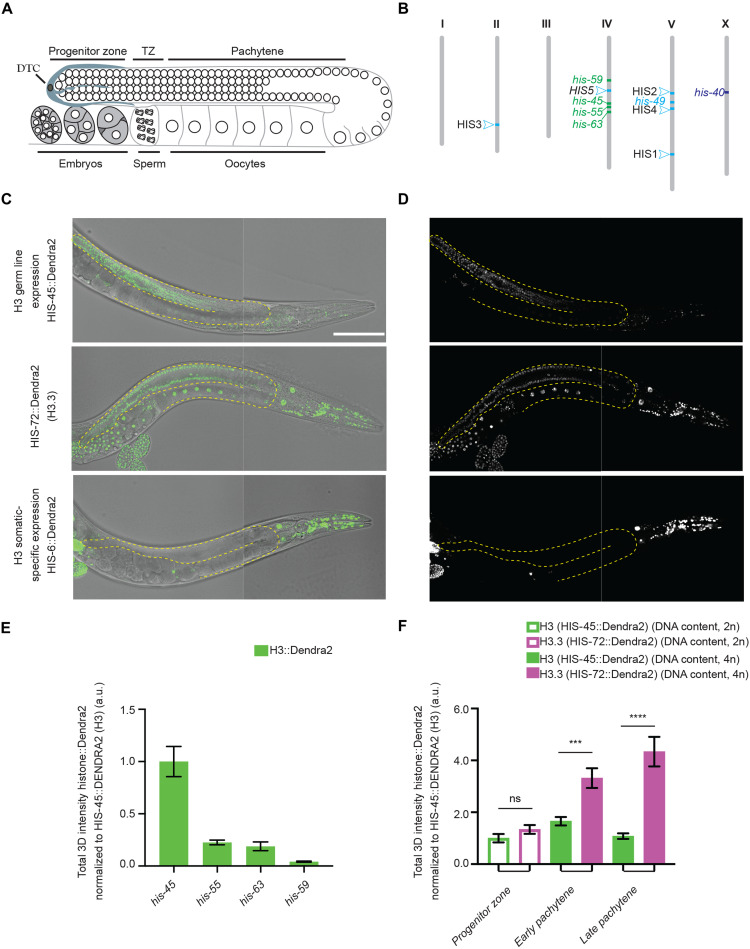
Fig. 1. Differential incorporation of the RC histone H3 gene family.
(A) Illustration of the C. elegans hermaphrodite gonad. DTC, Distal Tip Cell; TZ, transition zone. (B) Distribution of the different histone H3 genes in the genome of the C. elegans. Bristol N2 strain is represented using a distinct color code for each class identified, including the ubiquitously expressed class I histone H3 genes (including both germline and somatic lineages) in green, somatic-specific class II histone H3 genes in light blue, and his-40 in dark blue. (C and D) Representative differential interference contrast (DIC) image and fluorescence micrographs of CRISPR-tagged HIS-45::Dendra2 (H3) (green), the dashed lines outline the gonads. HIS-45::Dendra2 is an example of one of four class I H3 genes whose expression are detectable in both germline and somatic tissues. CRISPR-tagged HIS-72::Dendra2 (H3.3) shows ubiquitous expression including all somatic tissues and throughout the germline. CRISPR-tagged H3 gene HIS-6::Dendra2 expression is not detectable in the germline but is detectable throughout the somatic cell lineage, representing the expression pattern of 10 of 15 class II histone H3 genes. All images from (C) and (D) are taken using the same imaging settings. (E) Quantification of all four H3 genes expressed in the germline. For each condition, a minimum of three biological replicates were performed. The total amount of H3::Dendra2 present per mitotic/progenitor germline nuclei was quantified including his-45 (n = 9), his-55 (n = 15), his-63 (n = 15), and his-59 (n = 18). (F) Quantification of the most robust germline-expressed his-45 H3 gene along the distal-proximal gonadal regions per nuclei: germline stem cell (GSC) region (n = 18), early pachytene (n = 18), and late pachytene (n = 18); and his-72 H3.3 gene: GSC region (n = 21), early pachytene (n = 21), and late pachytene (n = 21). All quantifications = average ± SE. Unpaired t test was used for statistical comparison; ****P≤ 0.0001 and ***P ≤ 0.001. ns, not significant; a.u., arbitrary units. Scale bar, 100 μm.

