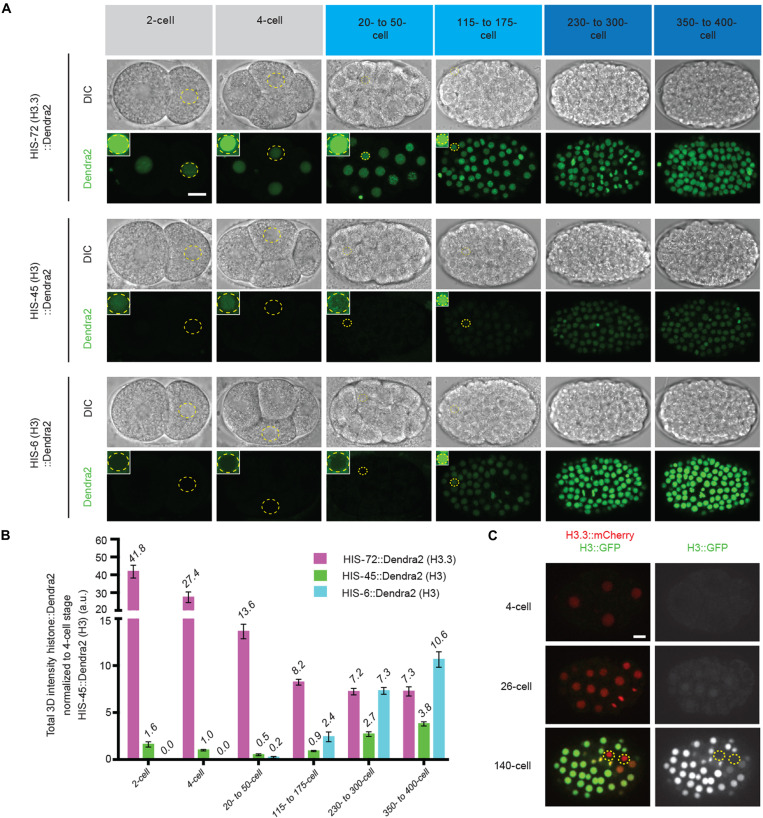
Fig. 3. The early embryonic epigenomic landscape is developmentally programmed to switch from histone variant H3.3-enriched to histone H3-enriched upon gastrulation.
(A) Representative images of embryos expressing H3.3-encoding his-72::Dendra2, germline-expressed, H3-encoding his-45::Dendra2, and somatic H3-encoding his-6::Dendra2 throughout the designated stages of embryogenesis including pregastrula (two- and four-cell; gray), earliest stages of gastrulation (21- to 50-cell and 115- to 175-cell; light blue), and after the onset of gastrulation (230- to 400-cell; dark blue), DIC (top), and Dendra2 (bottom). All images from (A) are taken using the same imaging settings, insets demonstrate that his-72 (H3.3) is readily detectable, whereas his-45 (H3) is barely detectable by increasing the brightness; however, his-6 (H3) is undetectable even with enhanced brightness but only becomes detectable at the onset of gastrulation (at the 26-cell stage). (B) Quantification of data sets from (A). For each embryonic stage, the total amount of Dendra2 representing either H3 or H3.3 per nuclei were quantified. All quantifications = average ± SE. (C) Snapshots from time-lapse movies of embryos expressing HIS-72::mCherry (H3.3) and HIS-55::GFP (H3) (see movie S3). The dashed circles outline the primordial germ cells. Scale bars, 10 μm.

