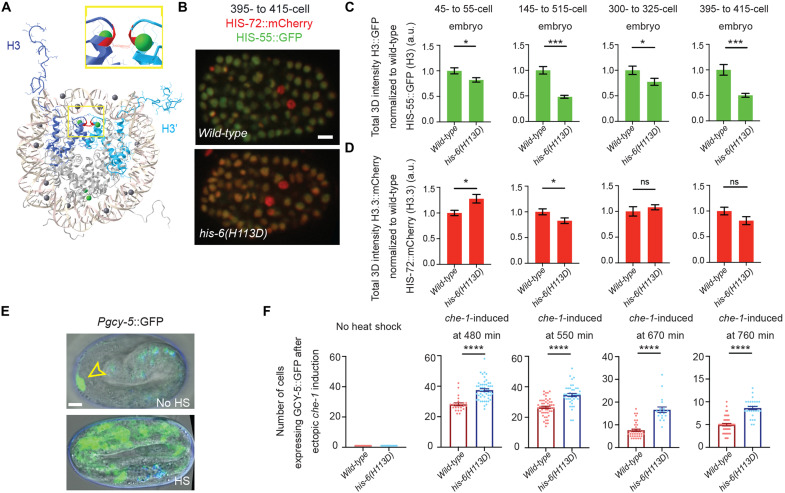
Fig. 5. A dominant-negative mutation in the somatic-specific histone H3 gene, his-6(H113D), destabilizes the histone tetramer (H3-H4)2, leading to reduced H3 incorporation and extended embryonic plasticity.
(A) Structure of histone H3 in the histone octamer, drawn with Cn3D (www.ncbi.nlm.nih.gov/Structure/CN3D/cn3d.shtml). The two H3 in the octamer (H3 and H3′) are colored in dark blue (H3) and light blue (H3′). The interface of H3 and H3′ maintains the (H3:H4)2 tetramer, for which the H113 (Red) → D mutation in the somatic H3-encoding his-6 gene has a dominant-negative effect by destabilizing the (H3:H4)2 tetramer specifically in somatic cells. A zoomed in view is displayed in the inset. (B) Representative images of embryos expressing H3.3::mCherry by his-72::mCherry and H3::GFP by his-55::GFP at the 395- to 415-cell stage to compare the H3::GFP levels in wild-type versus his-6(kog10)(H113D) mutant embryos. (C and D) Quantification of his-72::mCherry (H3.3) and his-55::GFP (H3) embryos at designated stages in wild-type vs. his-6(kog10)(H113D) embryos. (E) Embryonic plasticity assay: The top panel displays an embryo without heat-shock induction of che-1 expression, only the ASER neuron is labeled with bright gcy-5::GFP expression (yellow arrowhead) (signals that overlap with the blue channel are considered autofluorescence). The bottom panel is an example of heat-shock induced embryonic che-1 expression at 550 min into embryogenesis, gcy-5 expression is broadly activated. (F) Quantification of the number of cells per embryo expressing gcy-5::GFP in response to che-1 induction at different staged embryos. At each tested stage, embryos carrying the dominant negative mutation of his-6(kog10)(H113D) display more gcy-5::GFP-expressing cells per embryo challenged during the same time points including 480, 550, 670, and 760 min during embryogenesis, his-6(H113D) embryos resulted in a 38, 33, 118, and 72% increase in cells that are converted, respectively. Scale bars, 5 μm. All quantifications = average ± SE. Unpaired t test; ****P ≤ 0.0001, ***P ≤ 0.001, and *P ≤0.05.

