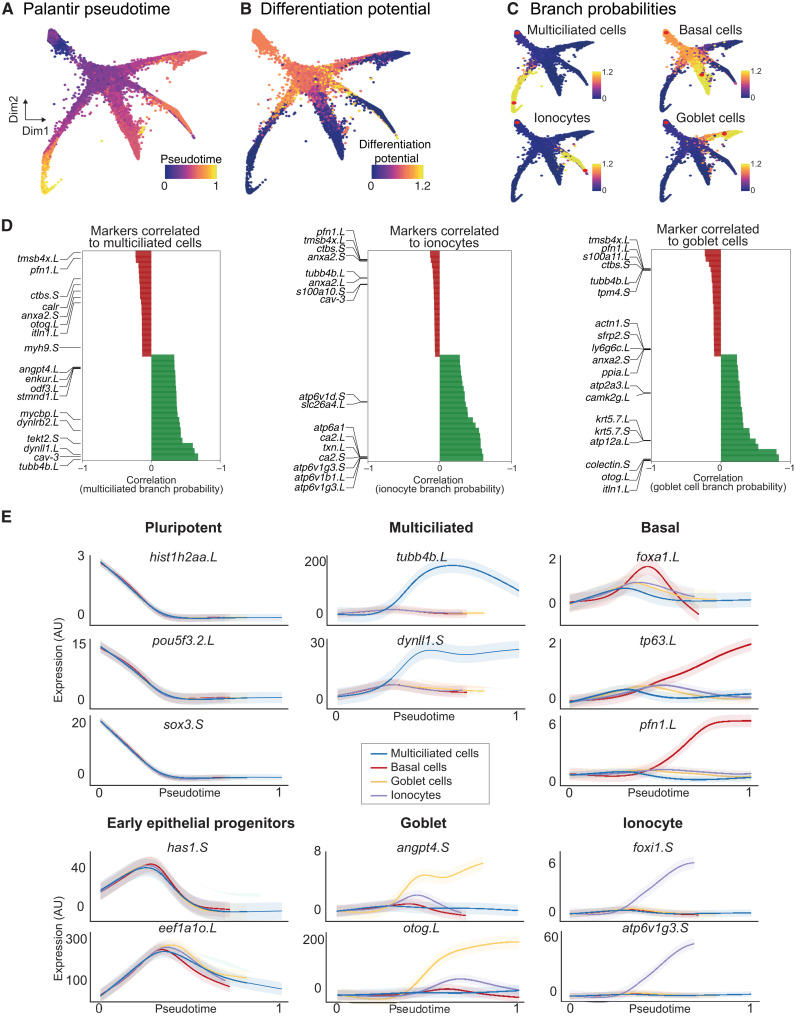
Fig. 3. Developmental transitions and cell state branching over MCE trajectories.
(A) Pseudotime inferred by Palantir overlaid on the MCE manifold (knn graph). The pluripotent cells mark the beginning of pseudotime, while terminal cell states (Mcc, Gc, Ic, and Bc) mark late pseudotime. (B) Differentiation potential overlaid on the MCE manifold (knn graph) exclusively marks pluripotent and progenitor populations. (C) Branch probabilities assessed for each late-stage cell type and overlaid over on the MCE manifold (knn graph). The red dots mark the start (pluripotent) and respective end cells (cell types). (D) Marker gene correlations to multiciliated, ionocytes, and goblet cell branches of the MCE manifold (knn graph). Green and red colors signify positively and negatively correlated genes, respectively. (E) Gene expression trends of marker genes, using generalized additive models, contributing to individual branch probabilities including pluripotent (hist1h2aa.L, pou5f3.2.L, and sox3.S), early epithelial progenitors (has1.S and eef1ao.L), multiciliated (pink; tubb4b.L and dynll1.S), basal (green; foxa1.L, tp63.L, and pfn1.L), goblet cells (orange; angpt4.S and otog.L), and ionocytes (blue; foxi1.S and atp6v1g3.S). The variable pseudotime reflects distinct cell type diversification and differentiation speeds over MCE development. AU, arbitrary units.

