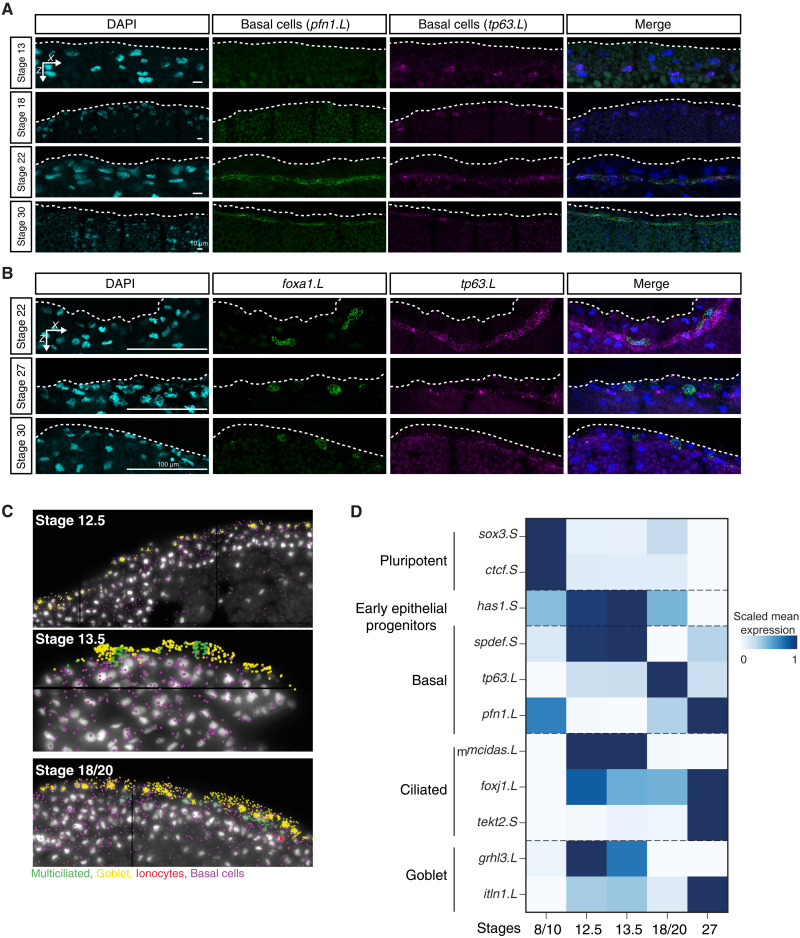
Fig. 8. In situ HCR validation of developing basal cell lineage over MCE development.
(A) In situ HCR of apical superficial epithelium indicating basal cells marked by profilin (pfn1.L; green), tumor protein P63 (tp63.L; magenta) across neurula (stages 13 and 18), and tailbud stages (stages 22 and 30); nuclei are marked by DAPI staining (in cyan, separate channel and in blue, merged channels). The expression levels of pfn1.L and tp63.L decrease by stage 30. Images (here and below) represent the maximum intensity projections of transverse cross sections, and white dashed lines indicate the apical superficial epithelium. (B) In situ HCR marked by forkhead box A1 (foxa1.L; green) and tumor protein P63 (tp63.L; magenta) across tailbud stages. (C) Representative images of single-cell multiplexed RNA imaging in whole embryos across three MCE developmental stages. Stages 12.5 and 13.5 mark the transition into neurula development. (D) Heatmap showing the RNA abundances of different cell type markers, as captured by multiplexed single-cell RNA imaging. The early epithelial progenitors are marked by the expression of multiple markers at early stages, while specialized cell types exclusively express markers at late stages. The color bars indicate z-scaled mean expression in aggregated cells.

