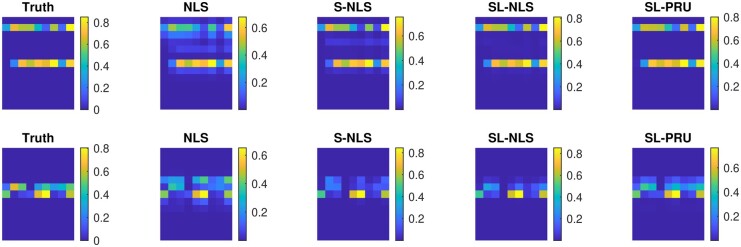
Figure 3.
Graphical representation of simulated image pixels that contain two colocalized endmembers, either AF514 and RRX [highly uncorrelated endmembers (top row)] or AF555 and RRX [highly correlated endmembers (bottom row)]. In each row, the “Truth” matrix represents the ground truth starting the simulation. Subsequent matrices represent the results of estimated abundances obtained from each of the unmixing methods that we considered. For each matrix, the 13 rows represent the 13 different endmembers used in the simulation and each column represents an independent pixel with varying intensity, scaled from 0 to 1. The color represents the mean abundance measure for each fluorophore from 1000 simulations of the same ground truth model after applying Poisson noise with SNR to each pixel

