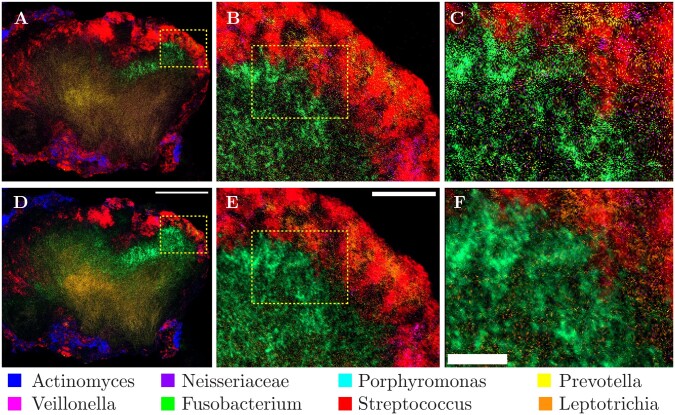
Figure 6.
Qualitative comparison of least squares and SL-PRU unmixing on a real biological sample. (A–F) Multi-spectral image of a dental plaque smear hedgehog structure after (A–C) least squares unmixing and (D–F) SL-PRU unmixing. Dashed boxes in (A) and (B) and in (C) and (D) indicate zoom area in C and D, and E and F, respectively. Scale bars equal 100 µm (D), 25 µm, (E), and 10 µm (F)

