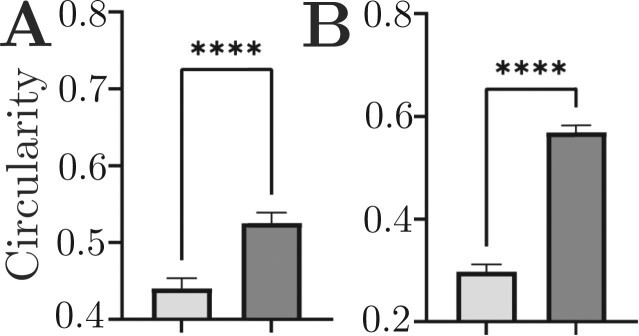
Figure 7.
Quantitative comparison of mean circularity measurement per cell for two coccoid-shaped cells in the plaque structure: Streptococcus (A) and Veillonella (B). Light grey bars = results from least squares unmixing, dark grey bars = results from SL-PU. Error bars represent 95% confidence intervals. ****P < .001 Welch’s t-test

