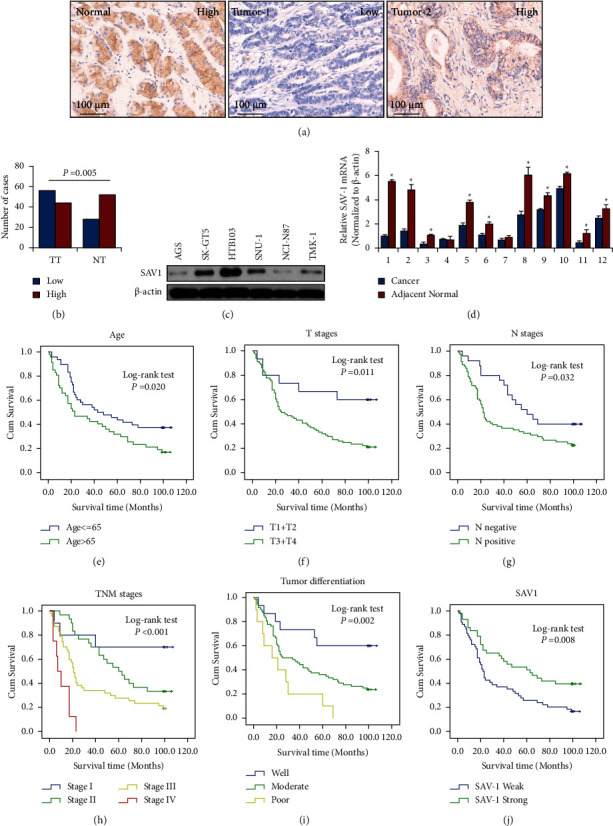
Figure 1.

SAV1 expression and its correlation with the clinicopathological features of GC. Tissue microarray GC specimens were immunostained with a specific anti-SAV1 antibody. (a) Representative images of SAV1 expression in adjacent normal gastric tissues and GC tissues. Markedly high SAV1 expression was observed in adjacent normal tissue (normal, left panel), low SAV1 expression was observed in tumor tissue (tumor 1, middle panel), and high SAV1 expression was observed in tumor tissue (tumor 2, right panel). (b) SAV1 expression was significantly lower in tumors (TT) than that in adjacent normal tissue (TN). (c) SAV1 protein levels in GC cell lines. (d) The mRNA levels of SAV1 in 12 paired GC and adjacent normal gastric tissues were measured using reverse transcription-quantitative PCR. (e) Age of >65 years (P=0.020), (f) invasion depth (P=0.011), (g) lymph node metastasis (P=0.032), (h) clinical stage (TNM stage) (P < 0.001), and (i) poorer tumor differentiation (P=0.002) were negatively associated with the OS of patients with GC. (j) SAV1 expression was positively associated with the OS of patients with GC (P=0.008). SAV1, Salvador homologue 1; GC, gastric cancer; OS, overall survival.
