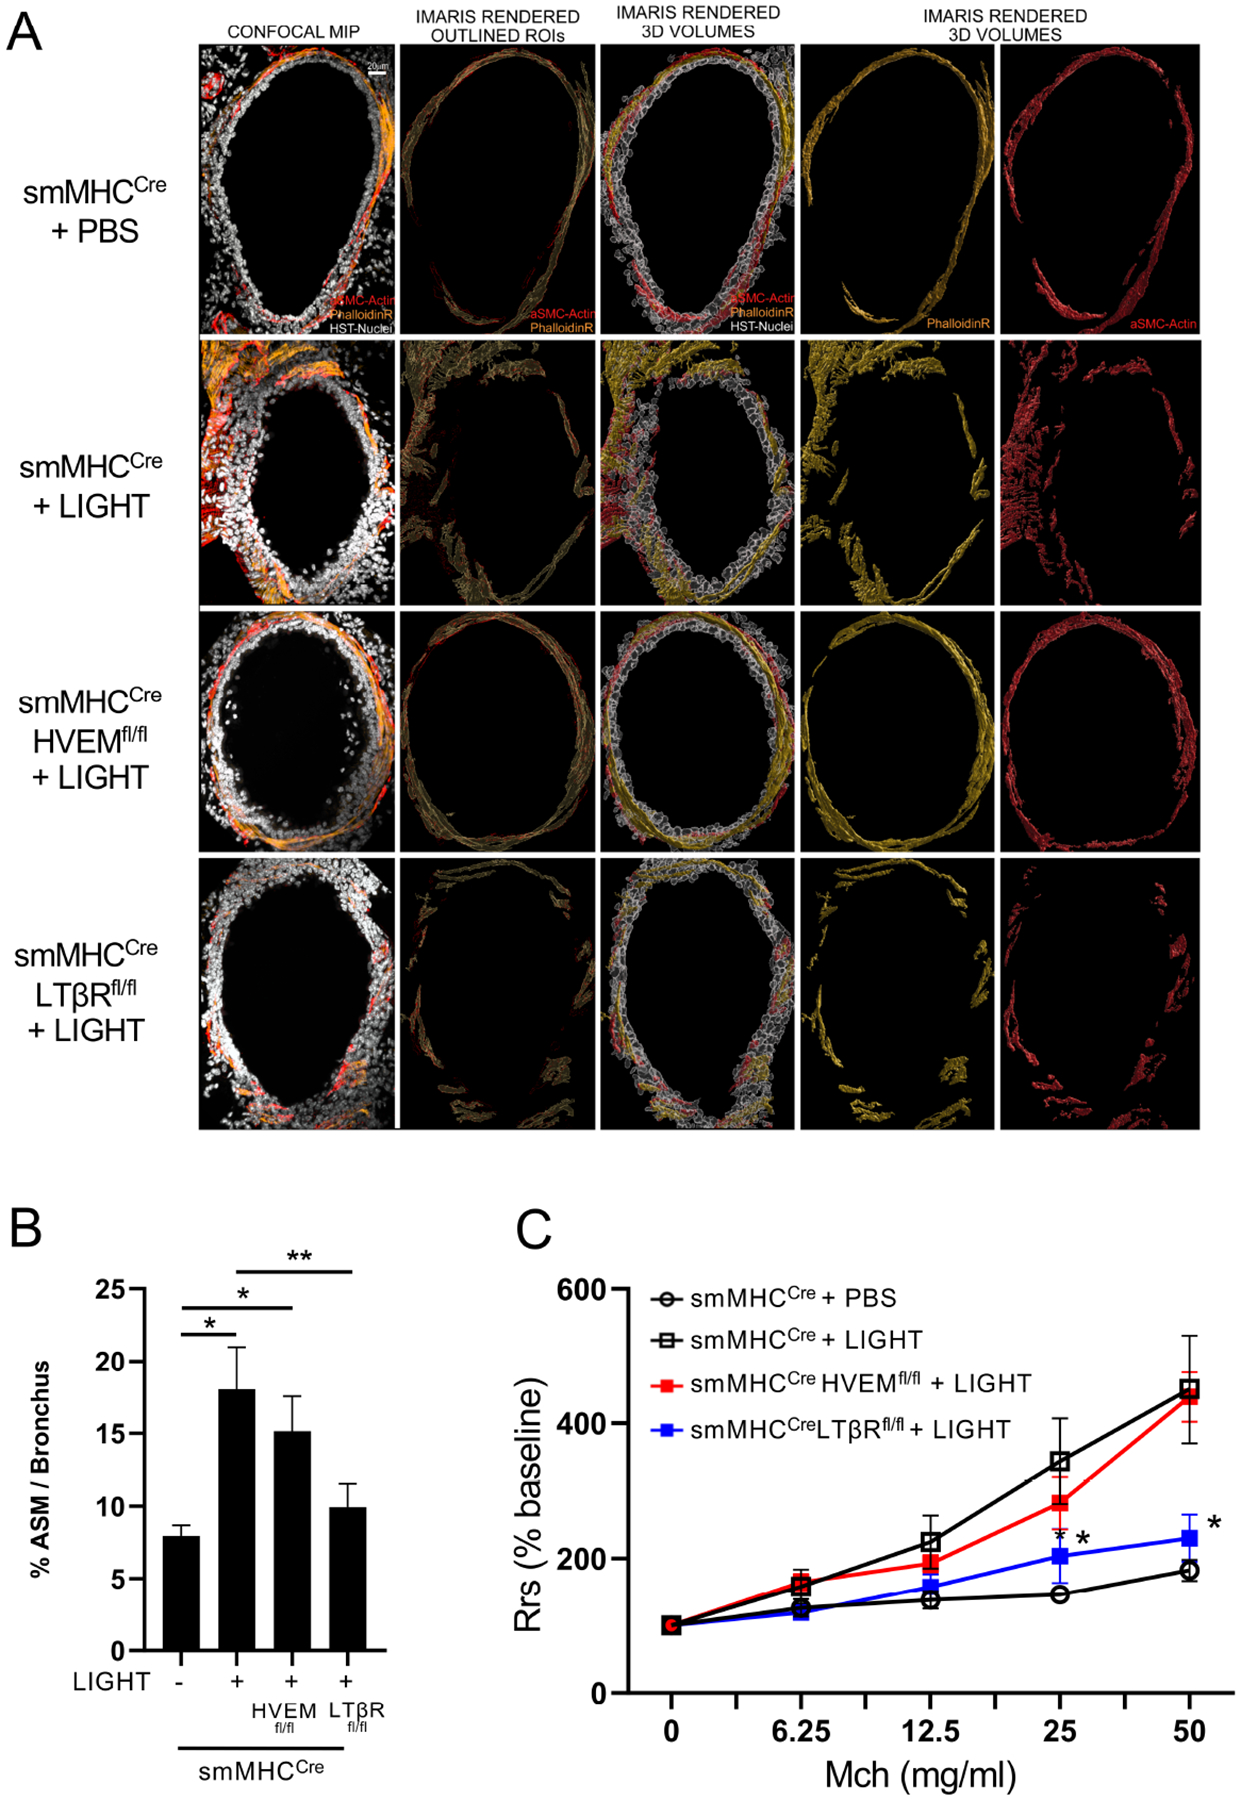
Figure 3. LIGHT-LTβR signals increase airway smooth muscle mass and induce AHR in mice.

Mice received intratracheal recombinant LIGHT or PBS over 3 days. (A-B) Confocal microscopy of lung bronchial sections for expression of F-actin (Phalloidin, yellow) and α-smooth muscle actin (red). (A) Representative images of bronchi (scale 20 μm). (B) Imaris 3D imaging analysis quantification of ASM volume (phalloidin) around individual bronchi (n = 4–5 mice/group, 10–15 tertiary bronchi per mouse). Data means ± SEM and representative of 3 experiments. *P < 0.05, **P < 0.01. (C) Airway resistance (AHR) after methacholine challenge, measured by Flexivent (n = 4 mice/group). *P < 0.05, smMHCCre vs. LTβRfl/fl. Data means ± SEM and representative of 2 experiments.
