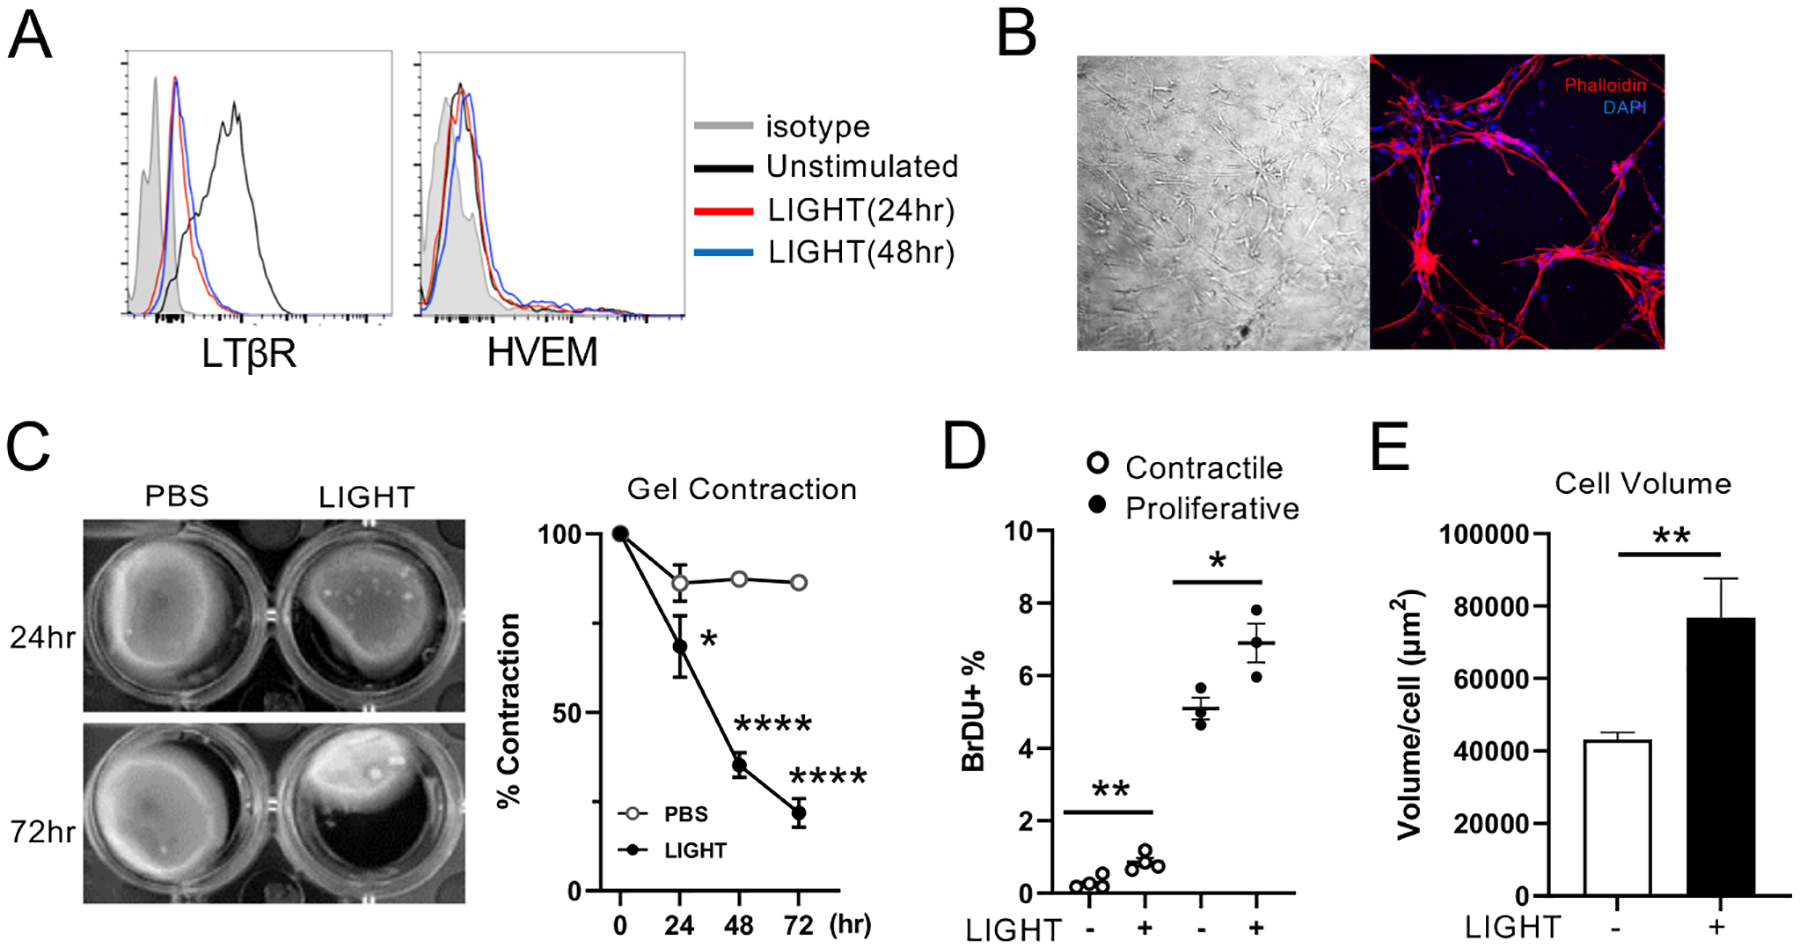
Figure 4. LIGHT induces human ASM proliferation and contractile activity.

(A) HVEM and LTβR expression on human ASM assessed by flow after stimulation with LIGHT for 24 or 48hr. Similar data in 3 experiments. (B) Images of ASM in collagen 3D gels. Left: Bright field, Right: Phalloidin (red), DAPI (blue). (C) ASM collagen gel contraction at 24–72hr after stimulation with LIGHT. Data combined means from triplicates from 3 experiments. (D) Percentages of BrdU+ ASM stimulated with LIGHT for 48hr. Cells either first incubated in serum free media for 16 hours for proliferative ASM, or for 7 days for contractile ASM. Data means of triplicates and representative of 3 experiments. (E) ASM volume after stimulation with LIGHT, measured by confocal microscopy. 300–400 ASM, in two replicate experiments were analyzed. Data means ± SEM. *P < 0.05, **P < 0.01, ***P < 0.001, ****P < 0.0001.
