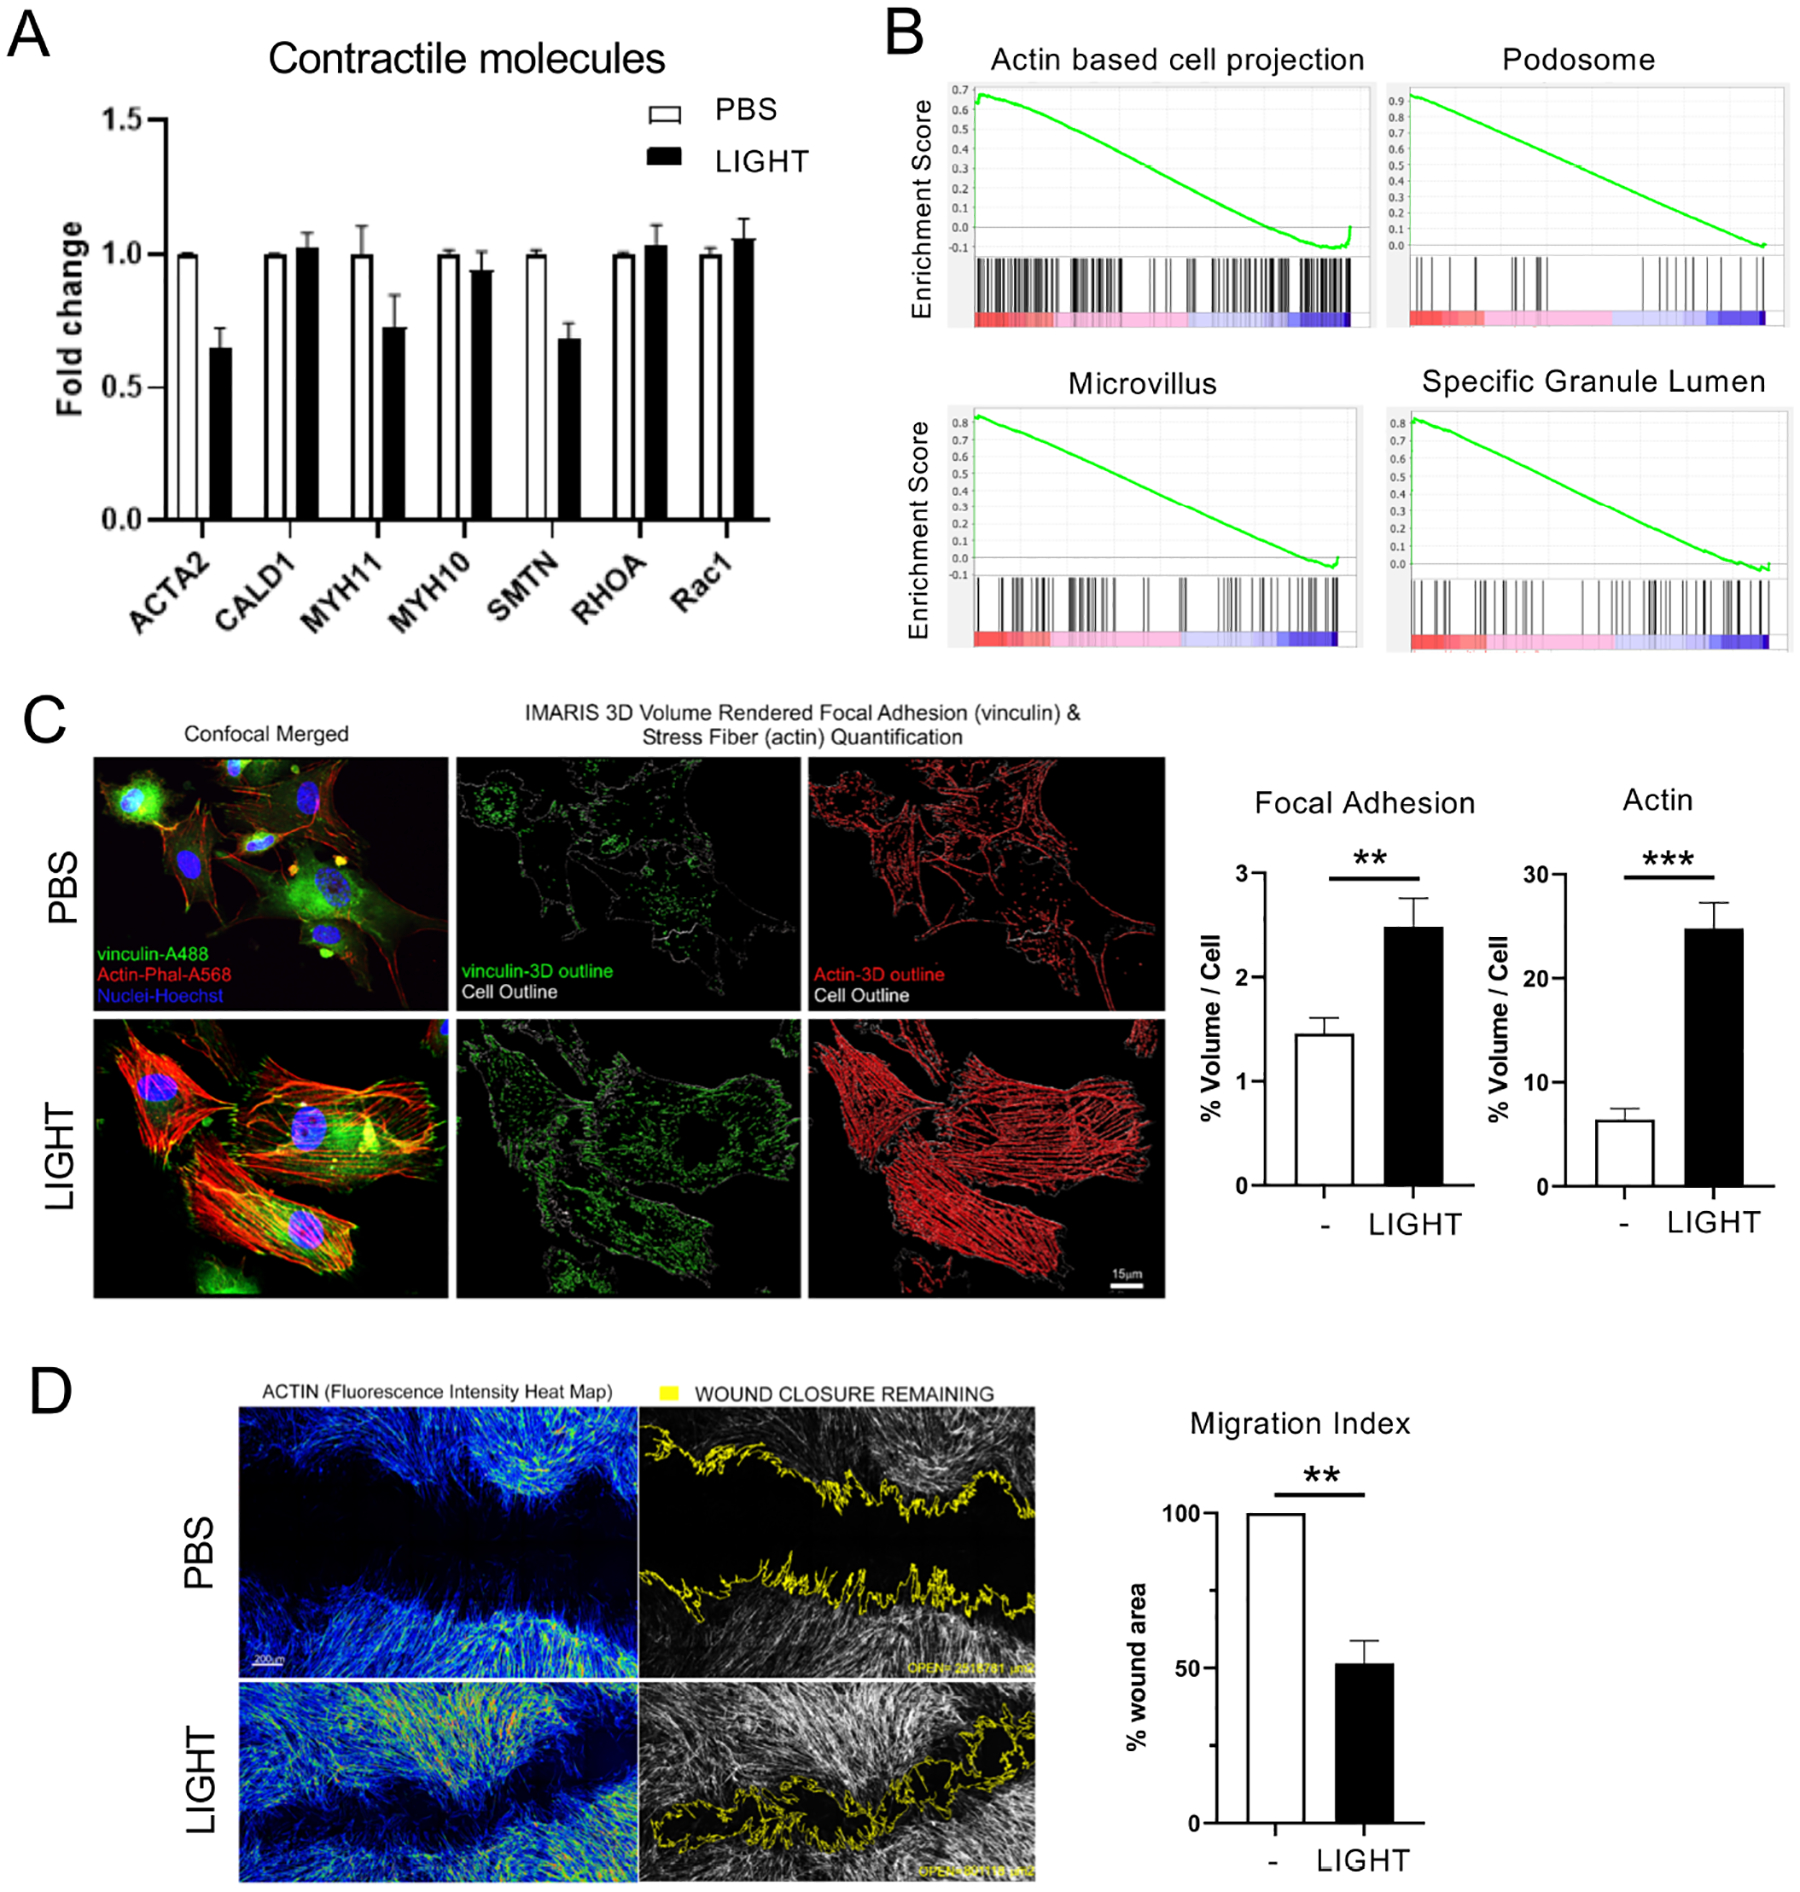
Figure 5. LIGHT induces actin polymerization and migratory ability in human ASM.

(A) RNA-seq analysis of contractile molecules in human ASM treated with LIGHT. Log2 fold change after 4hr compared to PBS treated cells. (B) GSEA of cell structure-related genes from RNA-seq of ASM stimulated with LIGHT compared to PBS for 4hr. (C) Confocal images of ASM treated with LIGHT for 6hr and stained with Phalloidin (red), Vinculin (green), DAPI (blue). Graphs show volume of F-actin (phalloidin) and focal adhesions (vinculin) normalized to individual cell sizes (scale 15 μm). 300–400 ASM, in two replicate experiments were analyzed. (D) Images of wounded monolayers of ASM stimulated with LIGHT for 12hr; left, fluorescence intensity of F-actin shown (yellow to red); right, remaining wound highlighted in yellow outline. Percentage of wound area remaining after LIGHT stimulation compared to PBS (scale 200 μm). Data combined from 3 independent experiments. Data means ± SEM. *P < 0.05, **P < 0.01, ***P < 0.001.
