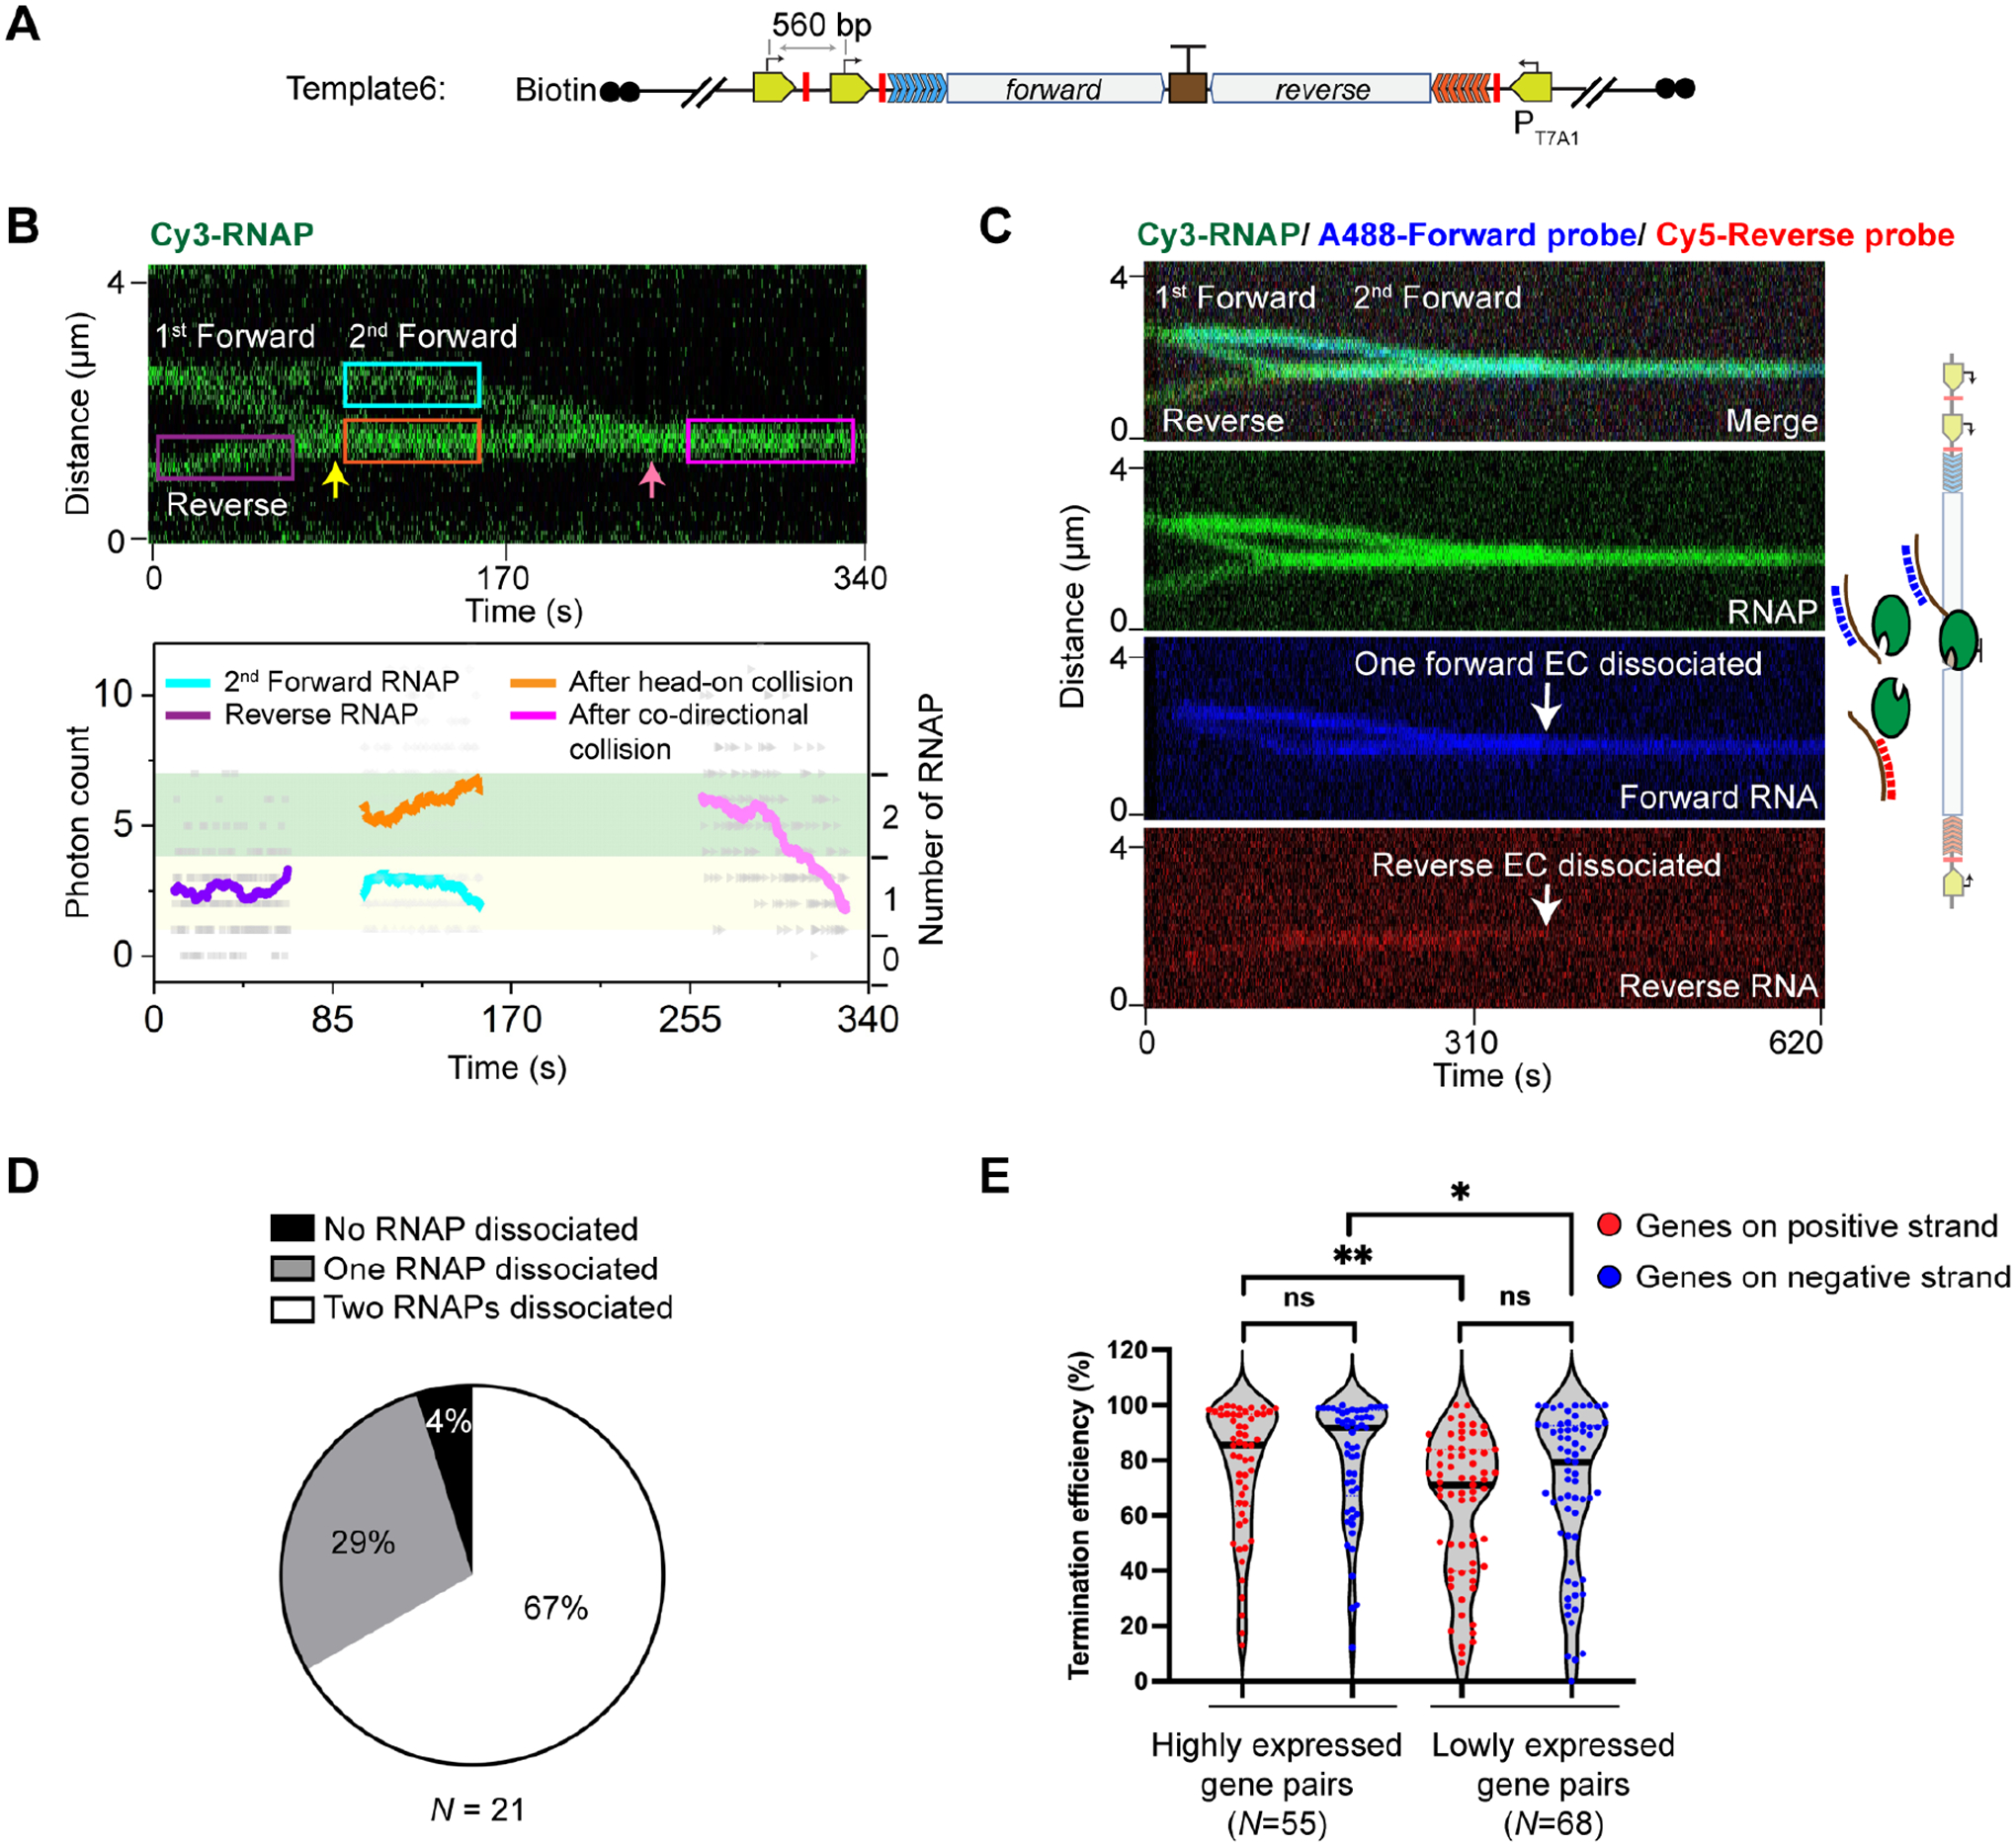
Figure 6. Outcomes of sequential head-on and co-directional collisions at the bidirectional terminator.

(A) Schematic of Template6, which contains an additional forward promoter and stall site compared to Template2.
(B) A representative kymograph (Top) and the corresponding fluorescence intensity profile (Bottom) showing a head-on collision (yellow arrow) followed by a co-directional collision (pink arrow) that involved two forward RNAPs and one reverse RNAP on Template6. The number of RNAPs for the selected regions (colored boxes) were analyzed and displayed in the same fashion as in Figure 4A. Two of the three RNAPs eventually dissociated in this example.
(C) A representative three-color kymograph (green for RNAP, blue for forward RNA, and red for reverse RNA) showing that co-directional collision by the second forward EC dislodged both forward and reverse ECs in the head-on collided complex from Template6 (white arrows).
(D) Pie chart showing the fraction of different outcomes (none, one, or two of the three RNAPs dissociated) after sequential head-on and co-directional collisions at the bidirectional terminator on Template6. N denotes the total number of sequential collision events.
(E) Violin plot showing the distribution of termination efficiencies for convergent E. coli gene pairs (positive-strand genes in red, negative-strand genes in blue) that were highly expressed (read counts > 100 for both genes) and lowly expressed (10 < read counts < 100 for both genes) in the SEnd-seq dataset. N denotes the number of gene pairs in each group. Significance was determined using two-sided unpaired Student’s t-tests (ns, not significant; *P < 0.05; **P < 0.01).
See also Figure S7.
