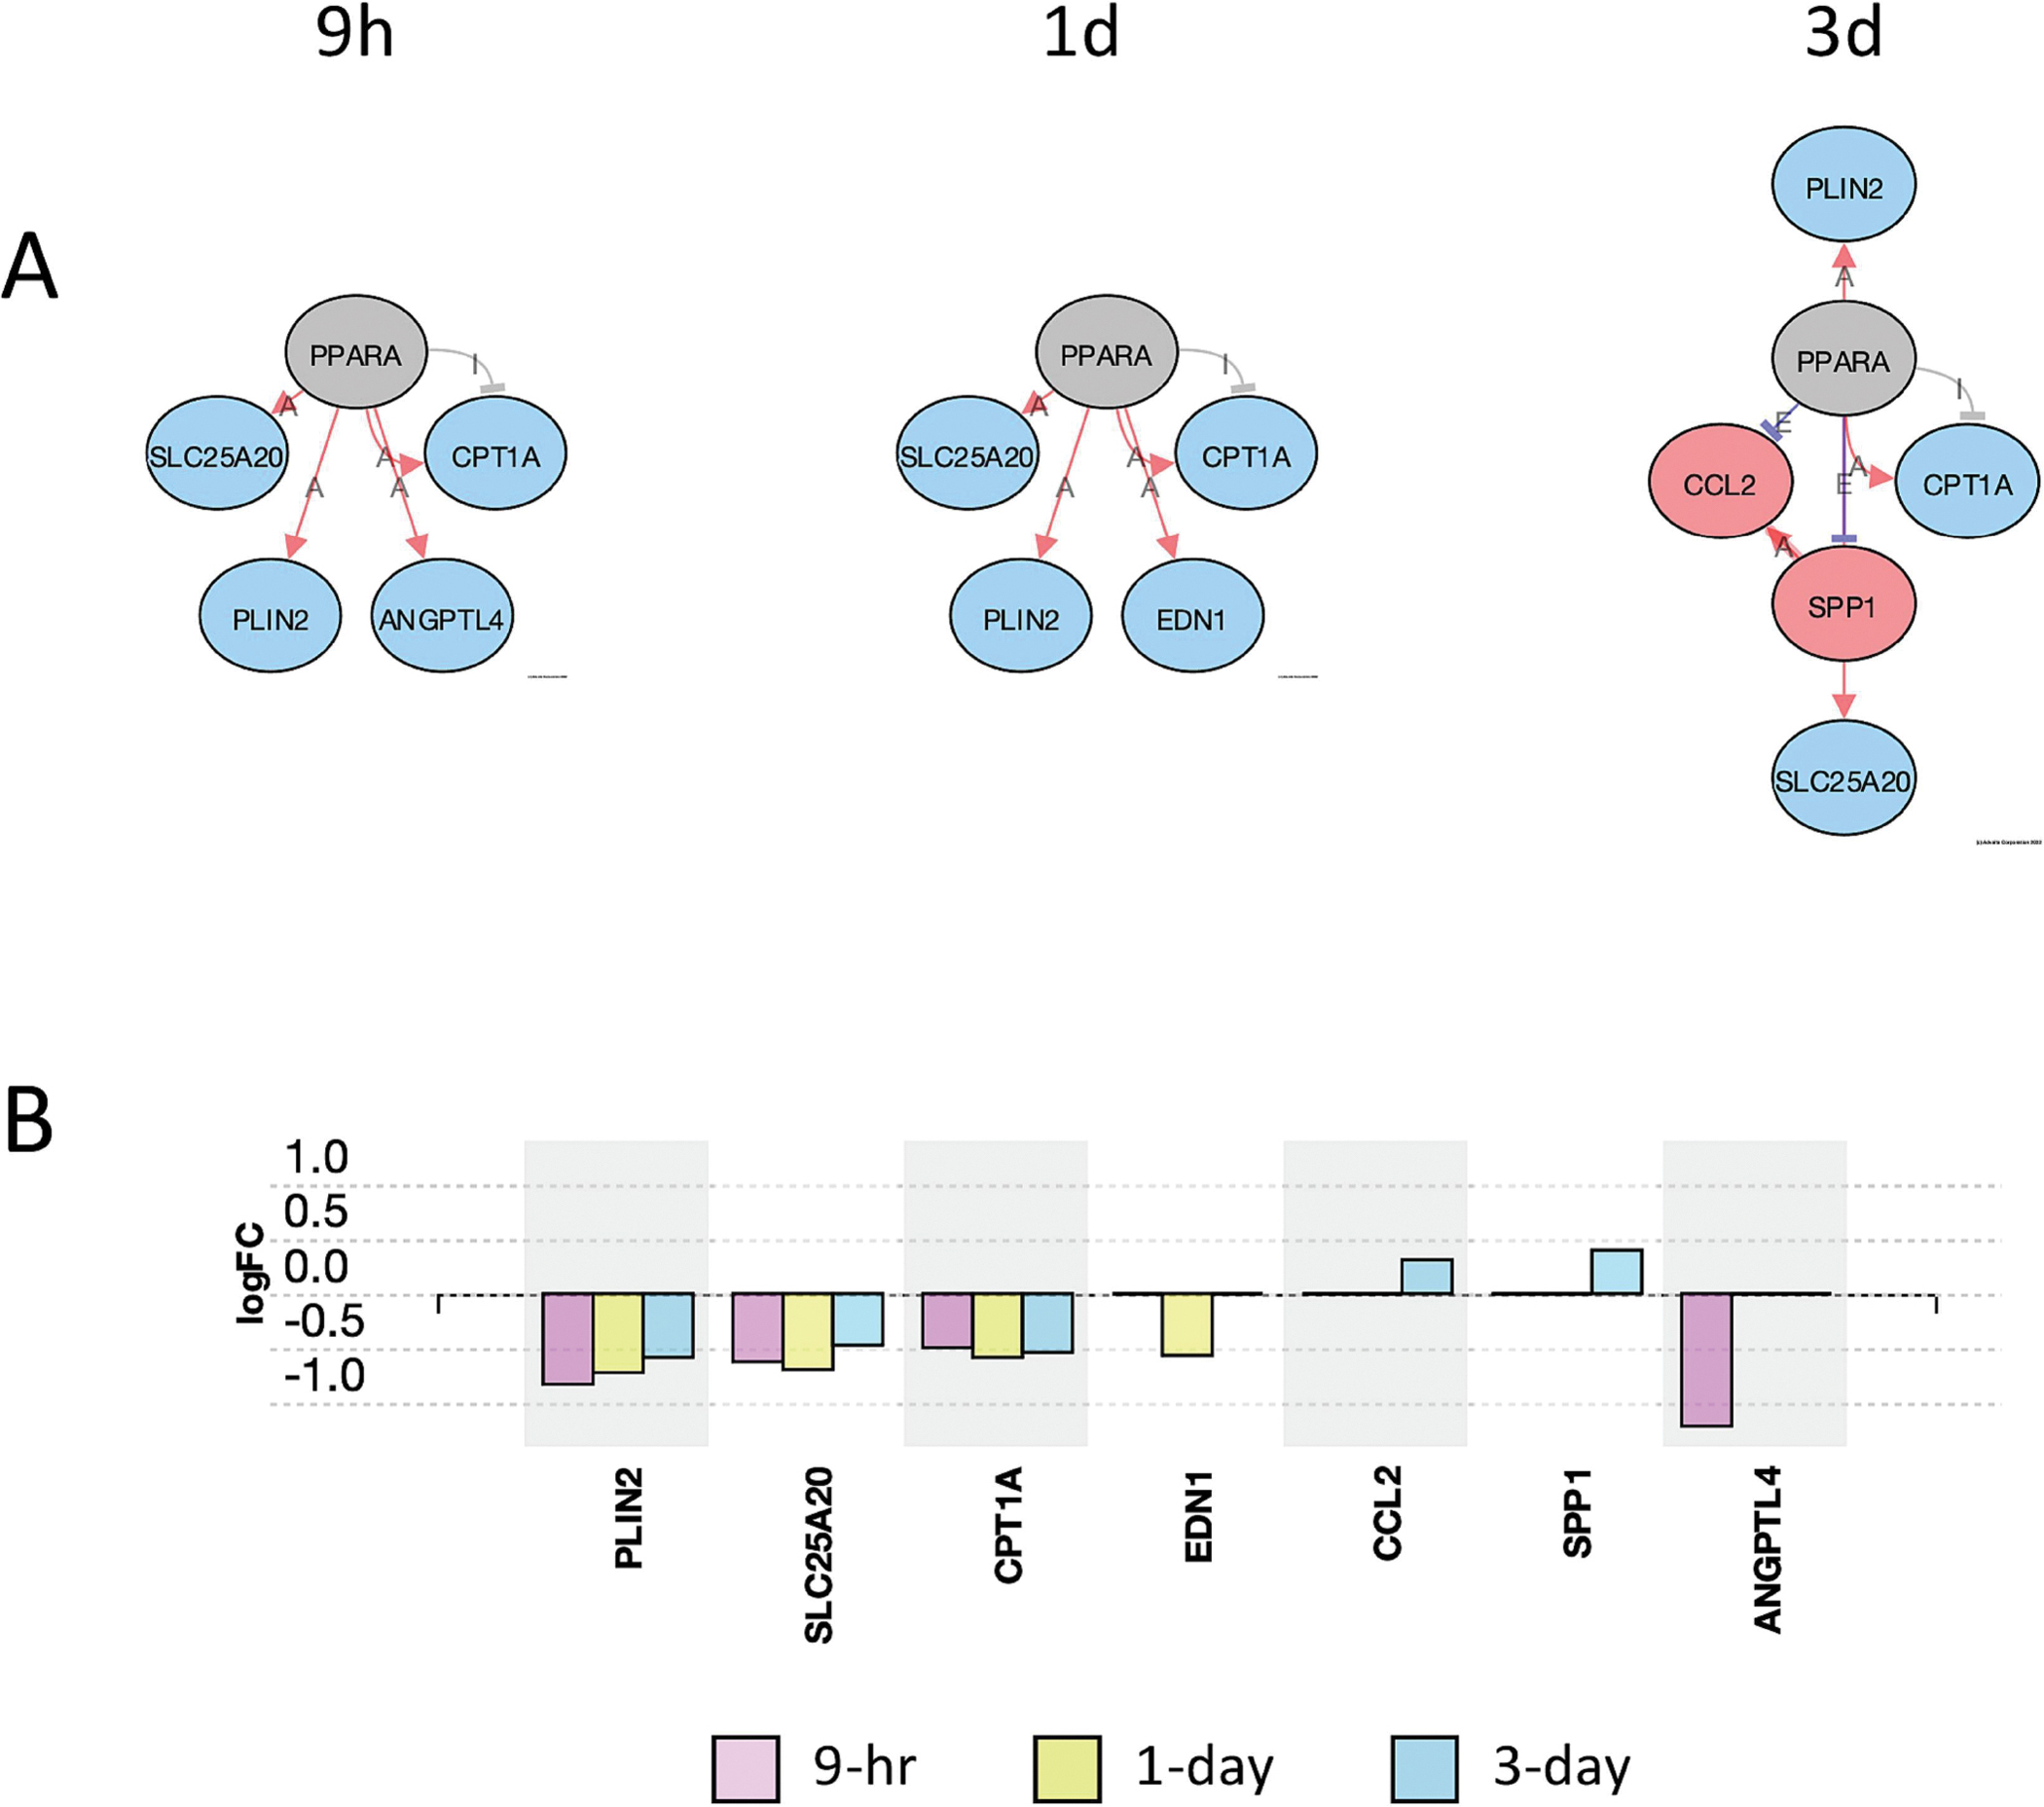
Figure 8:

Inhibition of PPARα pathway genes by PCB52 at different time points. A. Upstream regulator analysis showing actual and predicted relationships between genes in the PPARα pathway. Red Oval: Upregulated (actual); Blue Oval: Downregulated (actual); Gray or White oval: Unchanged or undetected (actual); “A”: Activated (predicted); “E”: Expression Inhibited (predicted); “I”: Inhibited (predicted); →Activation (predicted); ┤Inhibition (predicted). All time points were considered significant (p≤0.05, FDR≤0.05). B. Differentially expressed genes in the PPARα pathway at all time points for PCB52-treated preadipocytes. Values represent log2fold change over vehicle control.
