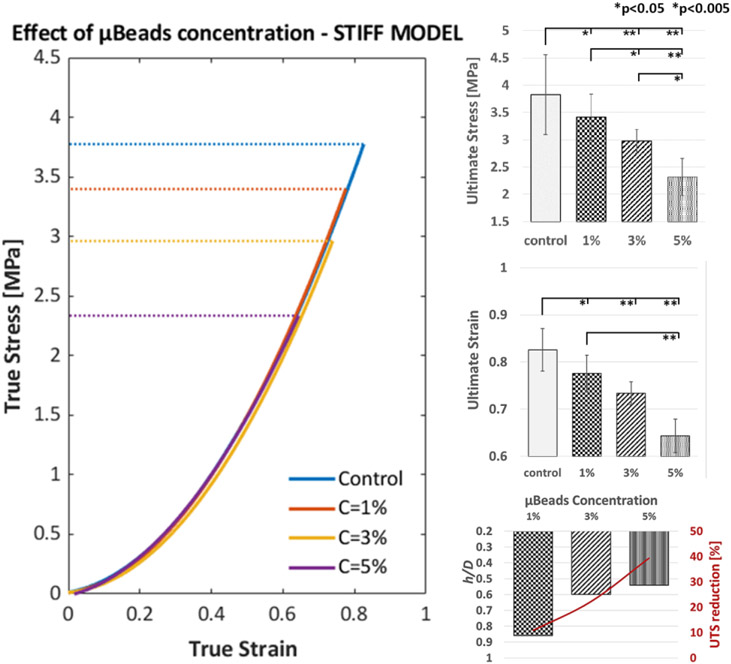
Figure 6.
Illustration of the effect of concentration and proximity of 40μm μBeads on the rupture threshold of stiff fibrous cap laboratory models. (Left) True stress vs True strain curves up to rupture of the control (no μBeads) group and samples with μBeads at 1%, 3% and 5% weight concentration; (Right) Bar plots of the ultimate tensile stress and strain of each group and the relationship between μBeads concentration, average minimum h/D and UTS reduction. Error bars represent standard deviation.

