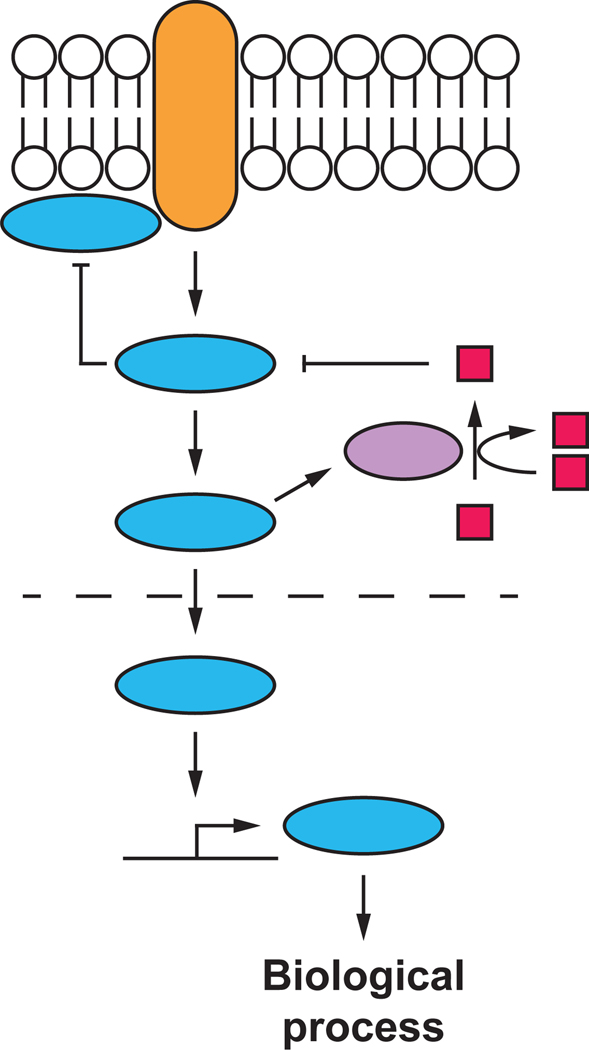
Figure 1. A typical pathway map for a biological process.
The regulation of biological processes is often conceived and summarized using pathway maps. In these maps, individual elements like proteins and metabolites are represented as colored shapes and connections between elements are depicted by positive (arrow) or negative (T bar) interactions. Here, different shapes and colors are used to indicate different notional types of molecules. The strength and importance of individual connections are not easily captured or specified in such maps.

