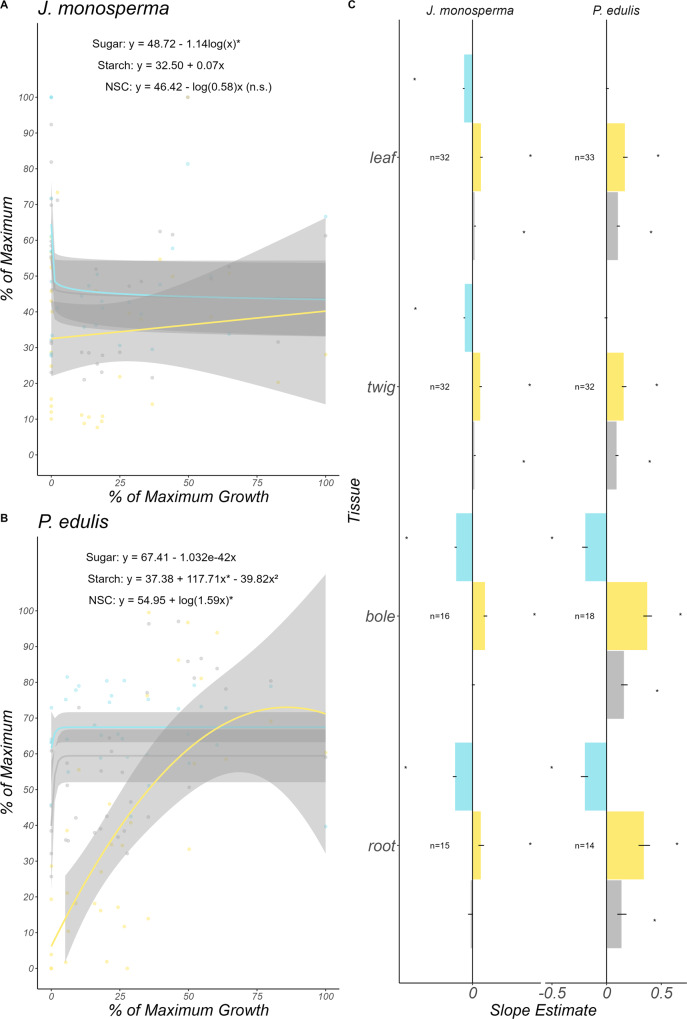
Fig. 4. NSC does not increase in J. monosperma and P. edulis as growth declines.
As growth becomes limited, NSC, starch, and sugar concentrations do not significantly change in J. monosperma (C). In P. edulis, a significant decline in NSC, driven by a decline in starch, may drive the significant increase in sugar concentrations in the bole. These tissue-specific patterns are reflected by the unweighted averages shown in (A, B). Points in (A, B) are observations of canopy sugar (blue points and line) and starch (yellow points and line). Lines in (A, B) represent point estimates of regression coefficients for the line of best fit, determined using the Akaike Information Criterion (Supplementary Table 11). C Bars represent point estimates of the regression coefficient for each NSC component and tissue against growth. Gray areas around lines in (A, B) and error bars in (C) indicate 95% confidence intervals. Tissue-specific regressions can be found in Supplementary Figs. 12 and 13.

