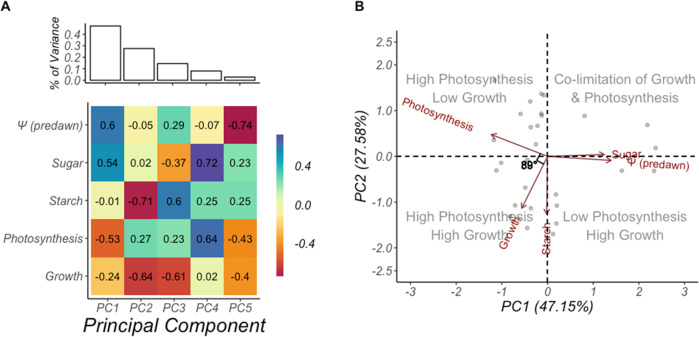
Fig. 5. couples photosynthesis to growth.
During drought, carbon availability is not the limiting process influencing growth rate. Drought-induced reductions in cell turgor independently limits growth and photosynthesis, explaining both sink-source co-limitation and the lack of correlation between growth and photosynthetic rates. Results of the principal components analysis on carbon supply and demand variables reveals that water availability () limits growth and photosynthesis and not carbon availability. PC1 explained 47.15% of the total variance in the data, and together PC1 and PC2 explain 74.73% of the total variance in the data. Along PC1, becomes more negative, drive sink-source co-limitation. Sugar concentrations increase as starch is depleted to support the metabolic and osmotic needs of both species. Growth and starch concentrations vary the most along PC2, reflecting the temporal patterns of plant phenology and starch accumulation (Supplementary Fig. 6). A A scree plot showing the amount of variance each principal component accounts for, and the eigenvectors associated with each principal component are shown. B Biplot of PC1 and PC2 are shown. Photosynthesis and growth contrast along all principal components except PC1 (water stress axis) and PC5 (which explained <10% of the total variance). This result stands in contrast to what theory and models would predict1,5,16,24. Based on theory, carbon demand drives carbon supply29 and starch accumulates inversely to growth1,5,24. Comparison between the inner product of and is indicated by θ = 89°; suggesting the two variables are orthogonal to each other. All variables (expect water potential, which is shown in absolute terms) are calculated as a percentage of the maximum observed for each tree. Each point indicates a specific observation where all variables overlapped (i.e., were observed for the same sampling month). Starch and sugar shown here are canopy averages only, due to the low sampling frequency of bole and root NSC measurements. A separate analysis across the entire growing season (NSC includes only needle and twig) can be viewed in Supplementary Fig. 5.

