Figure 1.
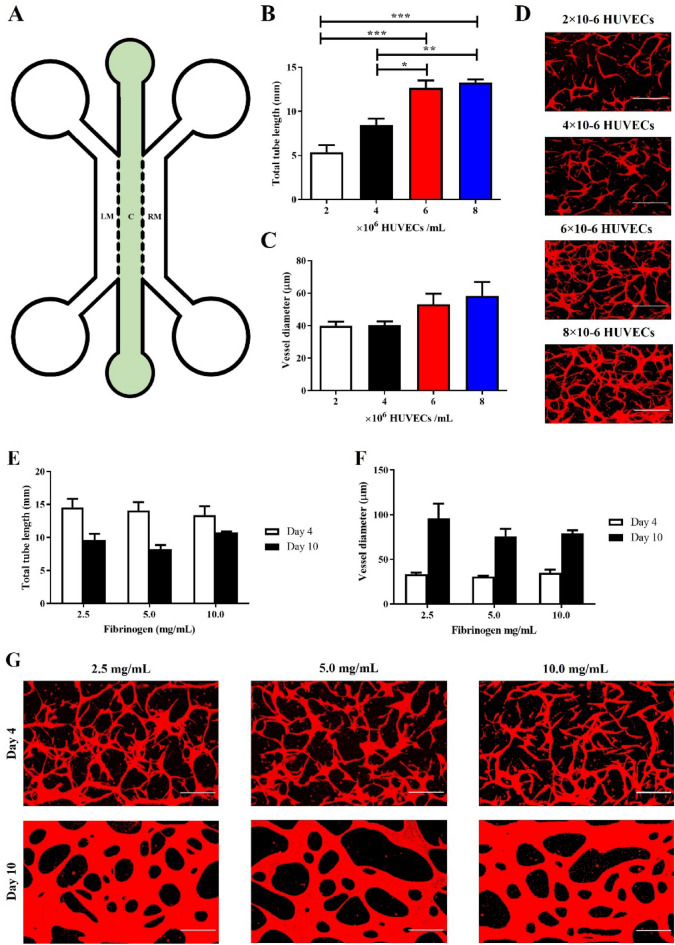
The impact of cell density and fibrinogen concentration on vasculogenesis. (A) Schematic of chip design. Central channel (noted c) is 1000 µm wide and separated from the lateral medium channels (LM and RM) by 300 µm long hexagonal posts, spaced by 75 µm gaps. (B) Increasing HUVEC density significantly increases total tube length (5.4 ± 0.8, 8.4 ± 0.7, 12.7 ± 0.9 and 13.3 ± 0.4 mm/field of view for 2, 4, 6, 8 × 10⁶ HUVECs/mL respectively). (C) HUVEC density had no significant impact on vessel diameter (mean range 39.8–58.4 µm). (D) Representative images of different HUVEC densities, z-projection images were generated from confocal images. Red, F-actin. Scale bar: 300 µm. (E) Fibrinogen concentration had no significant impact on total tube length at day 4 (mean range 13.4–14.5 mm/field of view), or day 10 (mean range 8.2–10.7 mm/field of view). (F) Fibrinogen concentration also had no impact on vessel diameter following 4 days (mean range 30.6–35.0 µm), or 10 days of culture (mean range 75.8–95.8 µm). (G) Representative images of networks formed at different fibrinogen concentrations, z-projection images were generated from confocal images. Red, F-actin. Scale bar: 300 µm. N = 3; n.s., non significant; *, p < 0.05; **, p < 0.01; ***, p < 0.001.

