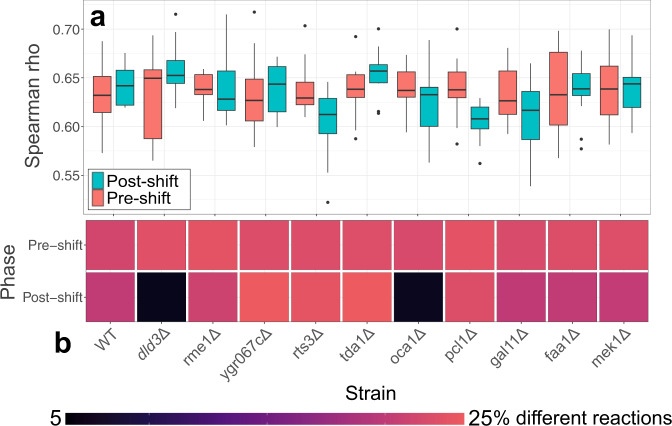
Fig. 4. Analysis of reaction flux reroutes in M1 and M1Smart.
a Distribution of Spearman correlations of pairwise comparisons between M1 and M1Smart simulations for knockout-strains and growth-phases. b Fraction of reactions significantly changed between simulations by models M1 and M1Smart (p-value < 0.1, Wilcoxon signed rank test). In the boxplots in a, the center lines represent the median; box limits represent upper and lower quartiles; whiskers extend to the first or last data point that is within 1.5× the interquartile range of the box limits in the lower and upper directions respectively. Dots are values outside of 1.5× interquartile range beyond either end of the box.

