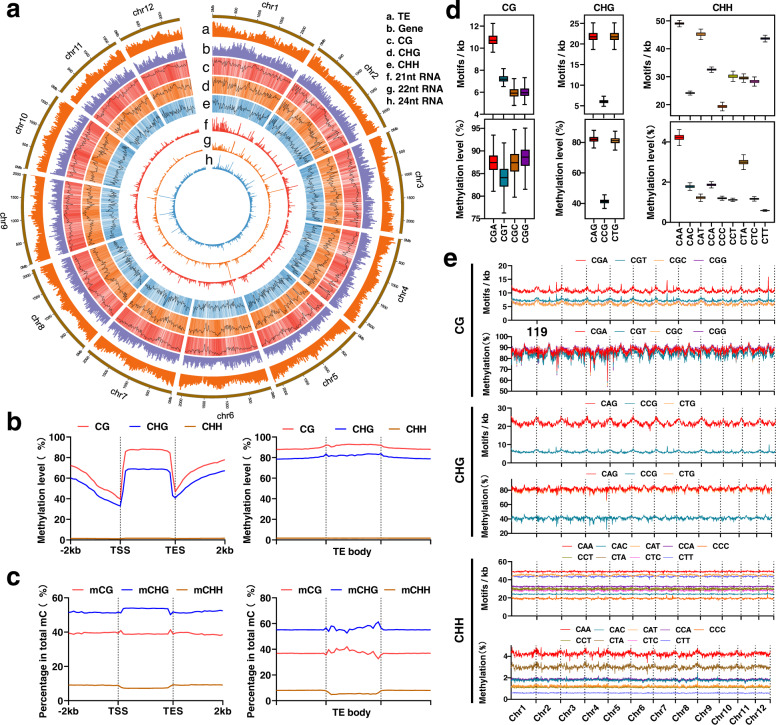
Fig. 1. Characterization of the DNA methylome of Chinese pine (Pinus tabuliformis).
a Methylation features depicted by using 20-Mb-wide bins across the 12 chromosomes. Units on the circumference show megabase values. Track a, repeat coverage. Track b, gene density. Track c, CG methylation level. Track d, CHG methylation level. Track e, CHH methylation level. Track f, 21-nt siRNA density. Track g, 22-nt siRNA density. Track h, 24-nt siRNA density. b DNA methylation levels of CG, CHG, and CHH for genes and TEs. c Percentages of mCG, mCHG and mCHH for genes and TEs. Value is calculated as the number of mC divided by the number of total C. d The densities of motifs and methylation levels of three sub-contexts across chromosomes were calculated per 20 Mb bin (bin number = 1227 for each sub-context). Horizontal lines, the lower and upper bounds of the boxes represent the medium values, the first and third quartiles, respectively; minima is the smallest data greater than or equal to the first quartile – 1.5 × interquartile range (IQR); maxima is the largest data point less than or equal quartile + 1.5 × IQR. e Densities of motifs and methylation levels of three sub-contexts across 12 chromosomes. Source data are provided as a Source Data file.

