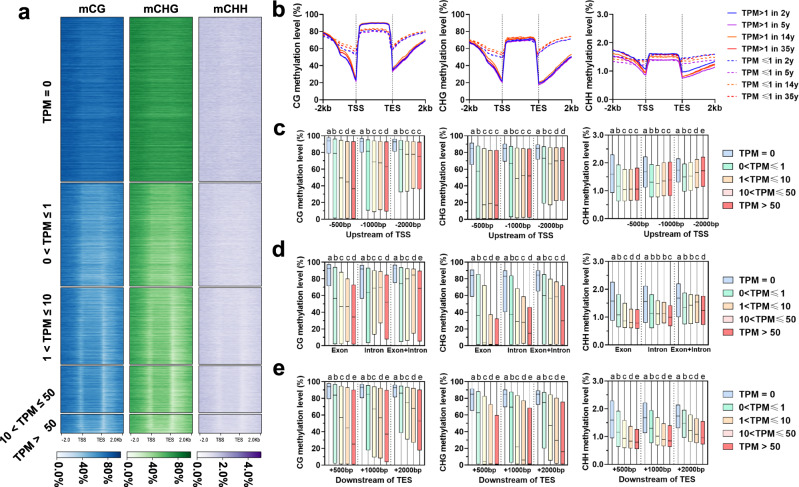
Fig. 2. Association between DNA methylation and gene expression.
a Methylation levels across gene body and flanking 2 kb regions of the five groups of genes based on expression levels. The gene body and upstream and downstream 2 kb regions were equally divided into 20 bins for methylation calculation, respectively. b Methylation levels across gene body and flanking 2 kb regions of the two groups of genes based on expression levels in each age sample. c Comparison of methylation between five groups of genes based on expression levels for three gene upstream regions. d Comparison of methylation levels between five groups of genes based on expression levels for genic regions including exon, intron, and exon+intron. e Comparison of expression levels between five groups of genes based on expression levels (gene number: N = 31954 for TPM = 0, N = 18967 for 0 <TPM ≤1, N = 13636 for 1<TPM ≤10, N = 8116 for 10<TPM ≤50, N = 3312 for TPM >50) for three gene downstream regions. Horizontal lines within boxes represent the medium values and the lower and upper bounds of the box represent the first and third quartiles, respectively. Statistically significant difference was analyzed using Mann–Whitney tests (two-sided test), different letters between any two groups represents significant difference (threshold p value <0.01) between them (for example, a, b), if two groups have the same letter then this indicates that they are not statistically different (e.g., c vs. c). Source data are provided as a Source Data file.

