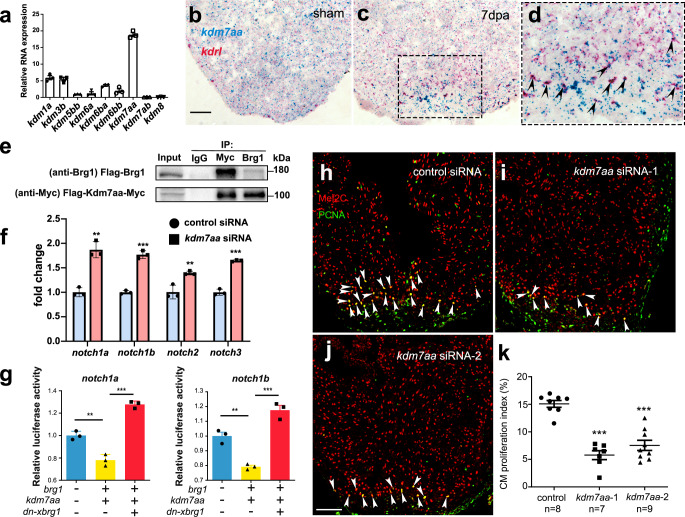
Fig. 5. Endothelial Brg1 regulates notch receptor expression and myocardial proliferation via interaction with Kdm7aa.
a Quantitative RT-PCR of kdm genes expression, normalized by gapdh. b–d Representative images of RNAscope in situ hybridization with kdrl and kdm7aa probes (scale bar, 100 μm) and high-magnification image of boxed region in (c) (arrowheads, double kdrl- and kdm7aa-positive endothelial cells). e Immunoprecipitation (IP) assays with either anti-Myc or anti-Brg1 antibody in 293T cells. Inputs were used as loading controls and IgG as negative controls. The blots were derived from the same experiment, and they were processed in parallel. f Quantitative RT-PCR analysis showing that the expression levels of notch1a, notch1b, notch2, and notch3 from hearts at 7 dpa injected with encapsulated kdm7aa siRNA was higher compared with the control siRNA group. Data represented one of three independent experiments. Data were mean fold changes ± s.e.m., ***p < 0.005, unpaired t-test. g Luciferase reporter assays in 293T cells stably expressing the notch promoter-luciferase reporter in the pGL4.26 vector. Expression plasmid clones containing kdm7aa, brg1, or dn-xbrg1 were co-transfected into cells stably expressing each notch reporter. Data represented one of two independent experiments, ***p < 0.005, one-way analysis of variance (F = 110.6 for the left panel and 60.3 for the right panel) followed by the Bonferroni test. n number shown here (f and g) indicated technical replicates. h–j Representative images of immunostaining showing the numbers of Mef2C+/PCNA+ proliferating cardiomyocytes (arrowheads, Mef2C+/PCNA+ proliferating cardiomyocytes; scale bar, 100 μm). k Statistics of panels (h–k) (n numbers indicated biological replicates; data were the mean ± s.e.m.; ***p < 0.005; one-way analysis of variance [F = 36.79] followed by Dunnett’s multiple comparison test).

