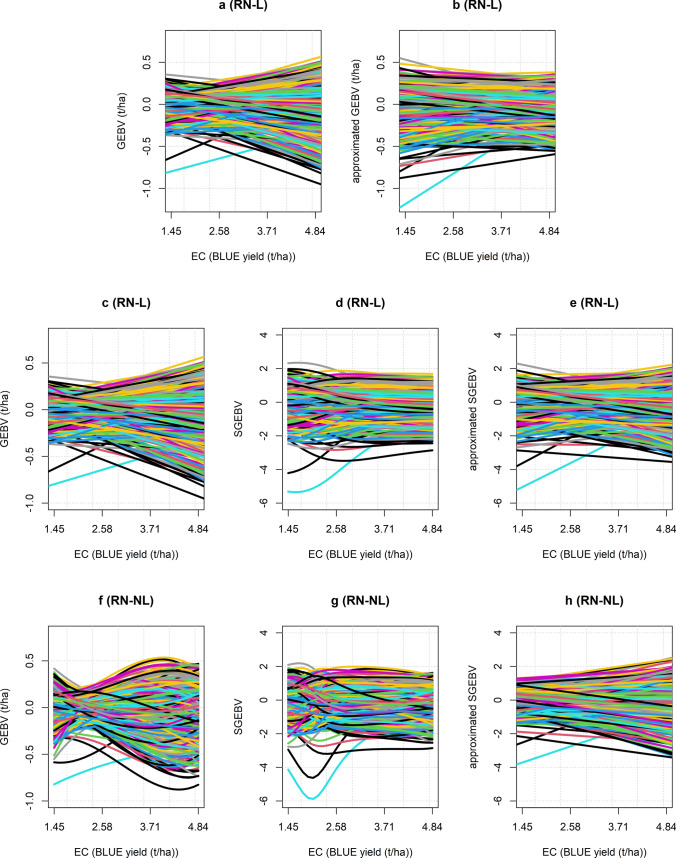
Fig. 5.
Reaction norms before and after applying the scale corrections. The top row shows the RN-L before a and after b applying the genetic regression, where the slope of each genotype is given by and , respectively. The middle row shows RN-L before c and after d standardisation, and a linear approximation of the standardised reaction norm e where the slope of each genotype is given by their average change in SGEBV across the entire EC. The bottom row shows RN-NL before (f) and after (g) standardisation, and a linear approximation of the standardised reaction norm (h) where the slope of each genotype is given by their average change in SGEBV across the entire EC. RN-L: linear reaction norm; RN-NL: nonlinear reaction norm

