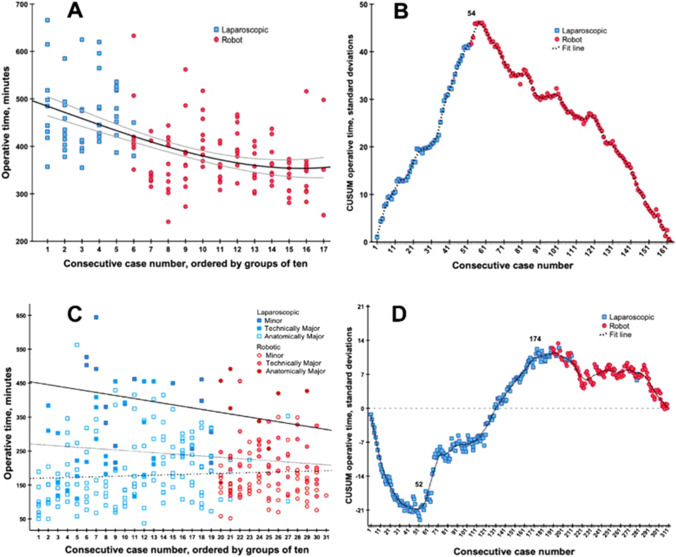
Fig. 3.
Competency learning curve of operative time in minimally invasive pancreatoduodenectomy and liver resections. A & C The X-axis indicated groups of 10 consecutive cases, color indicated per approach (laproscopic = blue squares, robotics = red dots), and the Y-axis indicates the combined operative time expressed in minutes (for liver resection, this way adjusted for extend of resection). The fit line indicated the mean operative time during the maturation of experience with grey lines indication in 95% confidence interval. B & D The X-axis indicates consecutive cases, color indicated per approach (laproscopic = blue squares, robotics = red dots) and the Y-axis indicates the CUSUM operative time expressed in standard deviations. In pancreatoduodenectomy, the label (n = 54) indicated the top turning point of the learning curve, hereafter, the learning curve follows a downward slope. In liver resections, the label [10] indicates the turning point where after both technically major- and anatomically major liver resections were performed. Hereafter, the label [174] indicates the top turning point of the learning curve for liver resections overall

