
Figure 2. CT structure.
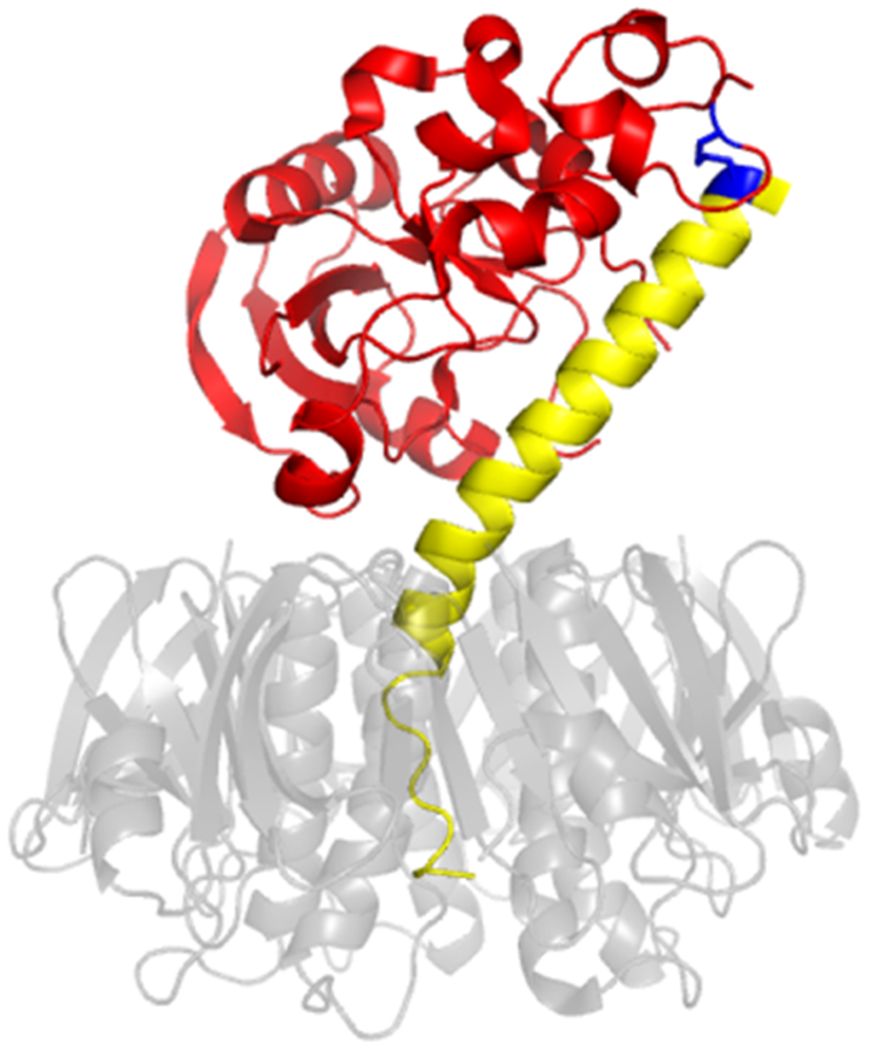
CT is composed of an A1 subunit with ADP-ribosyltransferase activity (red), an A2 linker (yellow), and a B homopentamer (translucent grey, in order to show extension of the A2 subunit into the central cavity of the ring-like B moiety). The paired cysteine residues of the CTA1/CTA2 disulfide bond are highlighted in blue. PDB entry 1S5F [54].