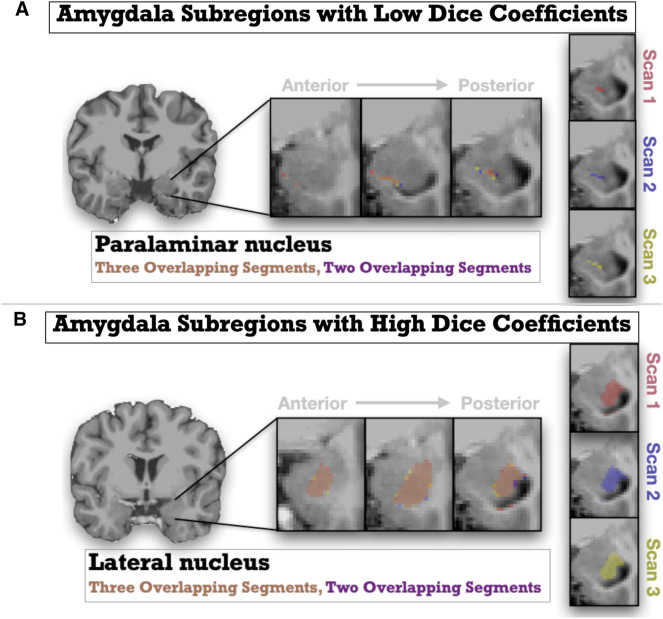
Fig. 6.
Graphic representations showing magnified depictions of Amygdala subregions with low and high Dice coefficients (i.e., spatial reliability) from repeated scans (Scan 1 shown in Red; Scan 2 shown in Purple, Scan 3 shown in Yellow). The anatomical (T1w) image underlaid is the unbiased subject template from an example participant. The top panel A represents the paralaminar nucleus, an area with low spatial reliability across scans, and the bottom panel B represents the lateral nucleus, and area with high spatial reliability. Slices move right to left from medial to lateral. Multiple slices are depicted left to right, moving anterior to posterior

