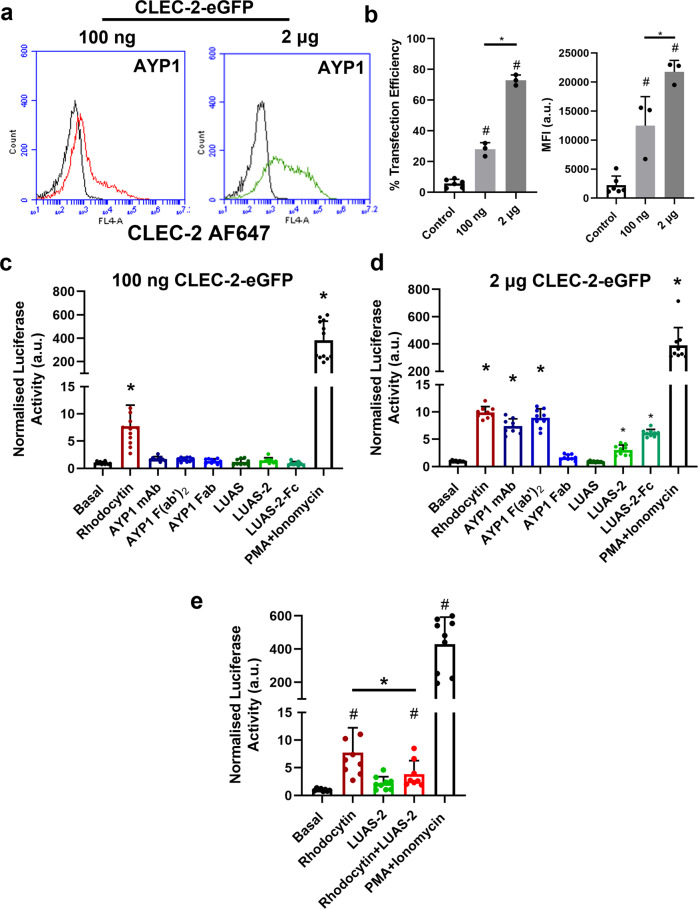
Fig. 6. Divalent and tetravalent ligands activate CLEC-2 in high- but not low-expressing transfected cells.
a Expression of CLEC-2-eGFP (100 ng and 2 μg) in DT40 chicken B cells was measured by flow cytometry using the anti-CLEC-2 AYP1 antibody (66 nM) with anti-mouse Alexa Fluor-647 secondary staining. The NFAT-luciferase reporter was also co-transfected. Black histograms show non-specific secondary staining alone. b Flow cytometry data presented as the transfection efficiency and MFI of CLEC-2-eGFP construct (100 ng and 2 μg) showing percentage of cells positive (n = 3 biologically independent experiments). c, d DT40 cells were transfected with an NFAT-luciferase reporter construct, and either 100 ng or 2 μg of the CLEC-2-eGFP construct. Cells were unstimulated or stimulated for 6 h and then lysed and assayed for luciferase activity. Luciferase activity normalised for basal values for 100 ng and 2 μg CLEC-2-eGFP unstimulated and stimulated with rhodocytin (30 nM), AYP1 mAb (6.6 nM), AYP1 F(ab’)2 (9.1 nM) and Fab fragments (20.8 nM), LUAS (10 nM), LUAS-2 (10 nM), LUAS-2-Fc (10 nM) and PMA (50 ng/ml) + ionomycin (1 μM) (positive control). Each experiment was performed in triplicate. e LUAS-2 is an antagonist to rhodocytin. Cells were unstimulated or stimulated for 6 h. Luciferase activity normalised for basal values for CLEC-2-eGFP (100 ng) unstimulated and stimulated with rhodocytin (30 nM), LUAS-2 (3 μM), rhodocytin (30 nM) + LUAS-2 (3 μM) and PMA (50 ng/ml) + ionomycin (1 μM) (positive control). Cells were incubated with LUAS-2 for 30 min prior to rhodocytin addition. In (b) and (e) # = statistical significance compared to control/basal. In (c) and (d) * = statistical significance compared to basal. Significance was measured with either a one-way ANOVA with Bonferroni post-hoc for (b) and Student two-tailed t test for (c–e) where P ≤ 0.05. All data are presented as mean ± SD (n = 3 biologically independent experiments).

