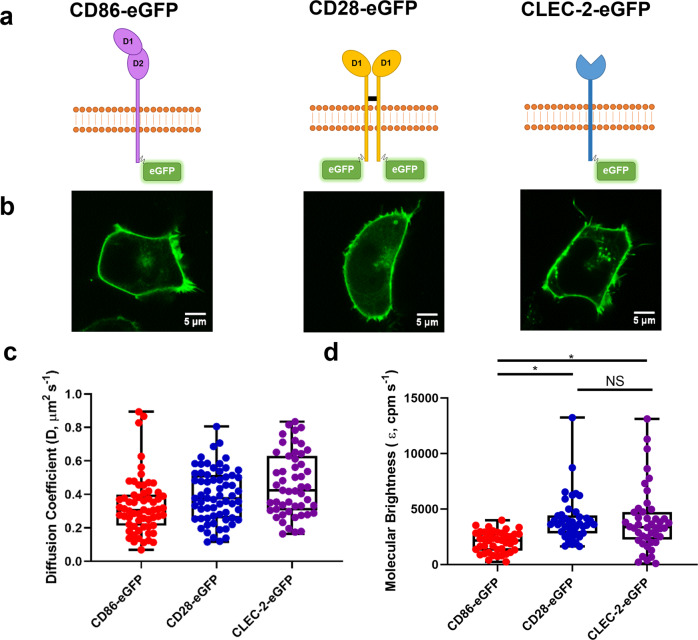
Fig. 7. Fluorescence correlation spectroscopy (FCS) shows CLEC-2 is a mixture of monomers and dimers.
a Schematic representation of C-terminal CD86-eGFP monomer control, CD28-eGFP dimer control and N-terminal human CLEC-2-eGFP. eGFP tags have an A206K mutation to prevent eGFP dimerisation. D1 = domain 1 and D2 = domain 2. b Representative confocal microscopy images showing membrane localisation of CD86-eGFP, CD28-eGFP and CLEC-2-eGFP in transfected HEK293T cells (field of view = 52 × 52 μm) (scale bar = 5 μm). c Box plot of CD86, CD28, and CLEC-2 diffusion coefficient data in HEK293T cells. The diffusion coefficients were calculated from the derived autocorrelation fits. d Photon counting histogram (PCH) analysis of CD86, CD28 and CLEC-2 to determine molecular brightness (ε, counts per molecule per second, cpm s−1) and stoichiometry of the receptors in HEK293T cells. 1-component PCH fitting was applied to raw PCH. NS = not significant. For all box plots, centre lines represent the median; box limits indicate the 25th and 75th percentiles and whiskers extend to minimum and maximum points. Significance was measured with Kruskal-Wallis with Dunn’s post-hoc where P ≤ 0.05. FCS measurements were taken in 53–70 cells (n = 6 biologically independent experiments).

