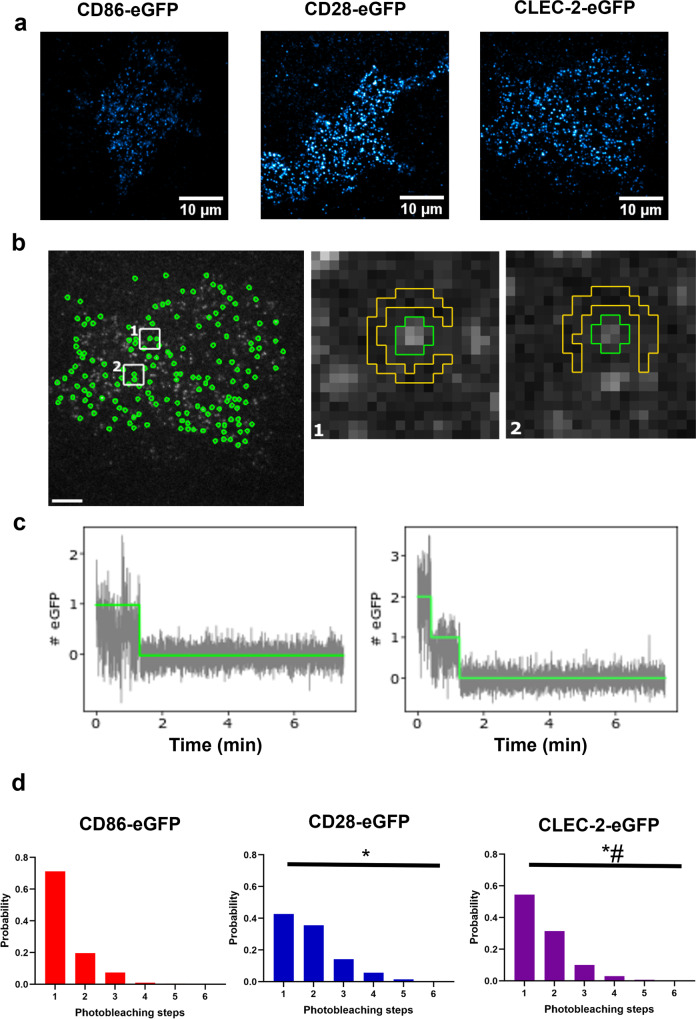
Fig. 8. Single-molecule stepwise photobleaching analysis shows CLEC-2 is a mixture of monomers and dimers.
a Representative total internal reflection fluorescence (TIRF) microscopy images with average intensity projections of the first 100 frames of the basal plasma membrane of transfected HEK293T cells expressing CD86-eGFP, CD28-eGFP and human CLEC-2-eGFP showing individual fluorescent spots visualised with lookup table cyan hot (field of view = 40 × 40 μm) (scale bar = 10 μm). b Representative image of the fluorescent spot detection following application of an automated spot detection algorithm of the entire basal membrane of the cell expressing CLEC-2-eGFP. Detected spots included in the analysis are shown in green and detected background is shown in yellow in panels 1 and 2 (scale bar = 5 μm). c Fluorescence intensity decay traces (grey) for individual spots showing photobleaching steps determined by the algorithm (green line). d Photobleaching step frequency histograms determined from all accepted spots for CD86-eGFP (red), CD28-eGFP (blue) and CLEC-2-eGFP (purple) in HEK293T cells. Significance of the distributions was measured with Epps-Singleton 2 sample test where P ≤ 0.05. * = significance compared to CD86-eGFP and # = significance compared to CD28-eGFP. Data pooled from 355 to 1008 traces (n = 3 biologically independent samples.

