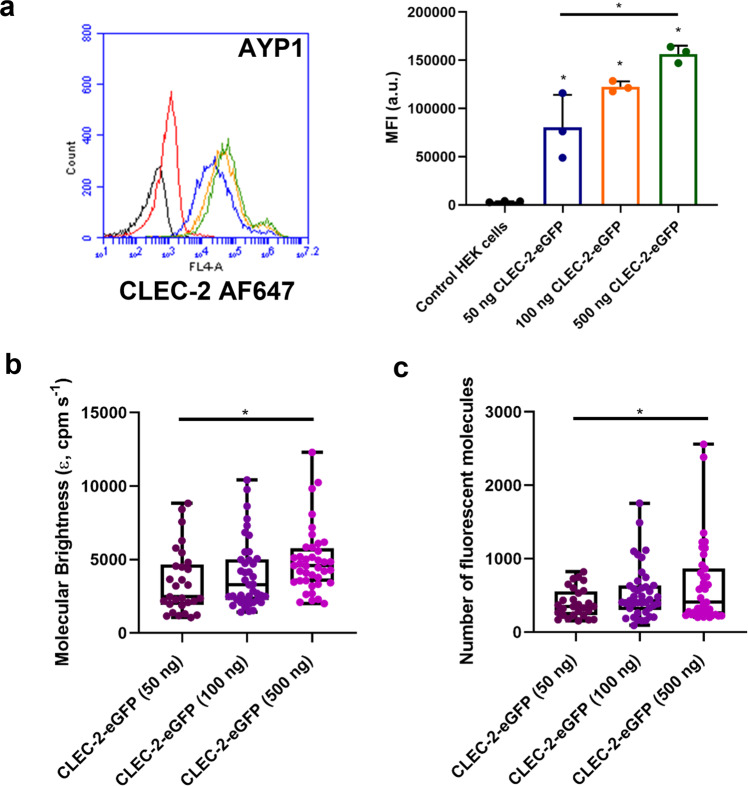
Fig. 9. CLEC-2 dimerisation increases with receptor expression.
a Wild-type HEK293T cells were transfected with 50, 100 or 500 ng of CLEC-2-eGFP DNA by PEI. CLEC-2-eGFP expression in HEK293T cells was measured by flow cytometry using mAb AYP1 (10 µg/ml) with Alexa Fluor-647 anti-mouse secondary antibody. Representative fluorescence intensity histograms for 50 (Blue), 100 (Orange) and 500 (Green) ng CLEC-2-eGFP transfected HEK293T samples. The black histogram shows HEK293T cells with no stain and the red histogram shows non-specific secondary staining alone. Flow cytometry data presented as MFI (a.u.). Data presented as mean ± SD (n = 3 biologically independent experiments). Box plots showing the effect of increasing receptor expression on CLEC-2-eGFP (b) molecular brightness (ε, counts per molecule per second, cpm s−1) and (c) number of fluorescent molecules within the confocal volume measured by FCS. For all box plots, centre lines represent the median; box limits indicate the 25th and 75th percentiles and whiskers extend to minimum and maximum points. Significance was measured with a one-way ANOVA with Bonferroni post-hoc for (a) and a Kruskal-Wallis with Dunn’s post-hoc for (b–c) where P ≤ 0.05. FCS measurements were taken in 45–67 cells (n = 3 biologically independent experiments).

