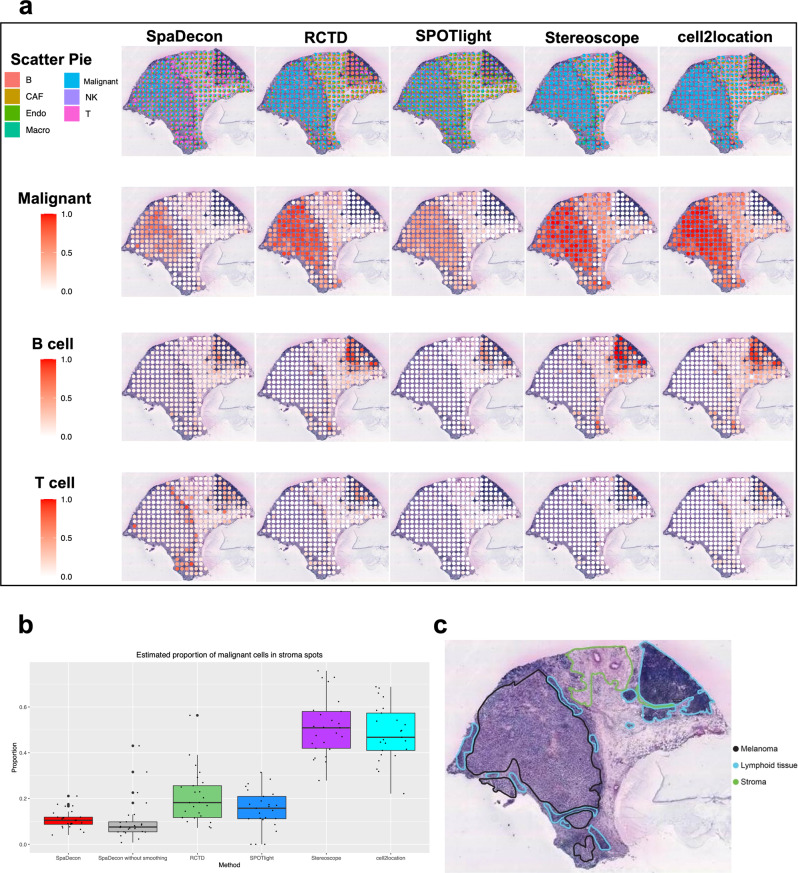
Fig. 4. Cell-type deconvolution results for stage III cutaneous malignant melanoma ST data.
a Scatter pie plots displaying the cell-type proportion estimates of SpaDecon, RCTD, SPOTlight, Stereoscope, and cell2location at each spot, along with heatmaps showing the estimated distributions of malignant, B, and T cells. b Boxplot showing the proportions of malignant cells across stromal spots estimated by each method (n = 25 spots). c Manual annotation of histology image of melanoma tissue section from which ST data were obtained.

