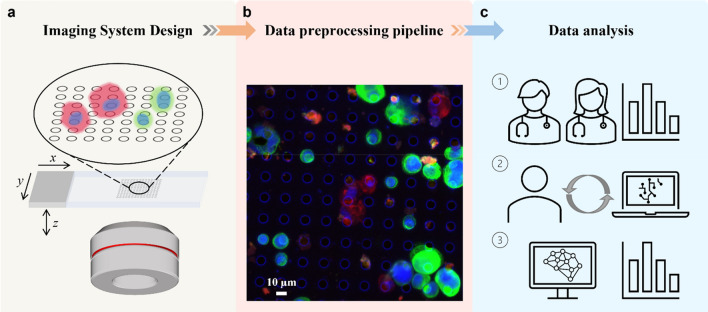
Figure 1.
Schematic of overall design. (a) Multi-channel epifluorescence microscope imaging system. Since our target cells are distributed on the micro-filter at varied heights, the sample is three-dimensional in nature. They are scanned axially under four channels to fully capture the cell-specific biomarker expression. (b) Data preprocessing pipeline. The raw image data are synthesized into a single multi-color all-in-focus whole slide image for further analysis. (c) Data analysis. The classical way to detect CTCs and CAFs relies on human experts. ① First, the experienced pathologists review the whole slide, annotate cells of interest, and count their number. ② Then this annotation paired with fluorescence images is used to train a deep learning model. Because of inherent human observer bias in calling or ignoring positive cells, the prediction from the pre-trained deep learning model is used to cross-validate human expert annotation. ③ Finally, the well-trained deep learning model can independently conduct the cell detection and analysis task.

