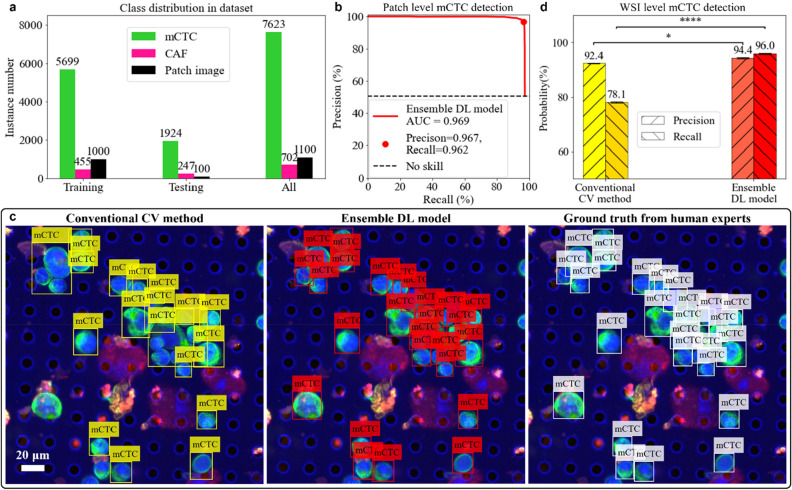
Figure 6.
Evaluation of mCTC detection. (a) Class distribution and the number of patches images in the training/testing/whole dataset. (b) Precision-recall curve of the ensemble deep learning (DL) model to detect mCTCs in testing patch images. The red dot represents the final chosen operating point. (c) Example of mCTC detection by conventional computer vision (CV) method and ensemble DL model shown horizontally with ground truth from human annotation. (d) Performance comparison between conventional CV method and ensemble DL model to detect mCTCs on the whole slide image level. Both precision and recall of ensemble DL model are significantly higher than the ones of conventional CV method. Statistical analysis uses the ensemble DL model result as the reference to test their difference significance, error bars show standard deviation of precisions and recalls by randomly sampling testing dataset 1000 times and the p-values are specified in the figure for *p < 0.05, **p < 0.01, ***p < 0.001, ****p < 0.0001, NS, not significant, two-sided z-test.

