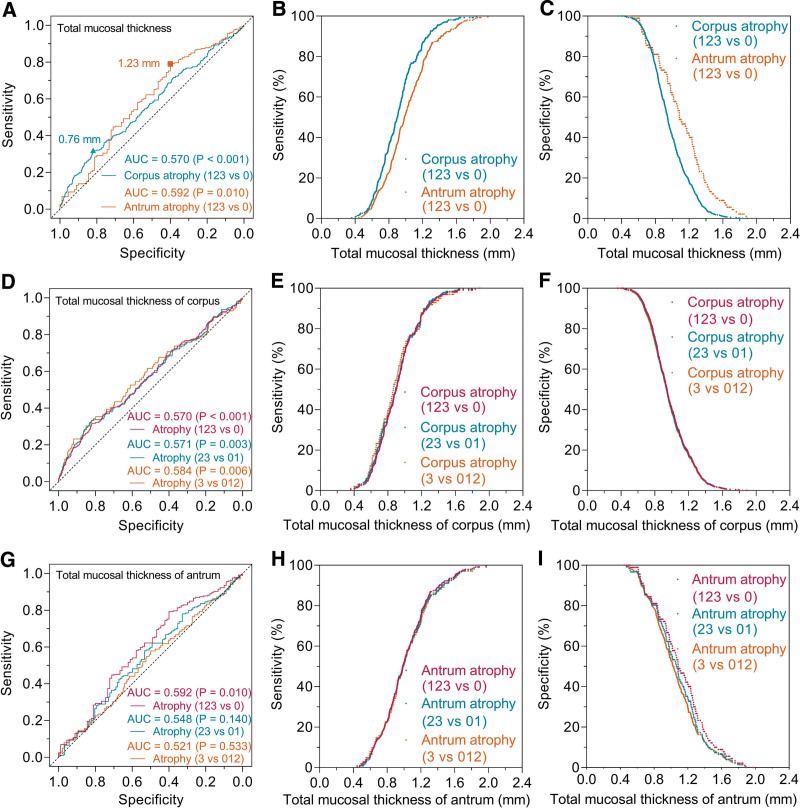
Figure 2.
ROC curves for diagnosing various atrophy by total mucosal thickness in gastric corpus and antrum. For discriminating between atrophic (grade 1 + 2+3) and non-atrophic (grade 0) mucosa (A), the optimal cutoff value in gastric corpus was 0.76 mm with a sensitivity of 32%, specificity of 82%, and AUC was 0.570 (P < .001). The corresponding value in gastric antrum was 1.23 mm with a sensitivity of 79%, specificity of 40%, and AUC was 0.592 (P = .010). In the corpus mucosa (D), ROC analysis showed that the AUCs were 0.570 (P < .001), 0.571 (P = .003), and 0.584 (P = .006) for the atrophy (grade 1 + 2+3 vs 0), moderate and severe (grade 2 + 3 vs 0 + 1), and severe (grade 3 vs 0 + 1+2) atrophy, respectively. In the antral mucosa (G), ROC analysis showed that the AUCs were 0.592 (P = .010), 0.548 (P = .140), and 0.521 (P = .533) for the atrophy (grade 1 + 2+3 vs 0), moderate and severe (grade 2 + 3 vs 0 + 1), and severe (grade 3 vs 0 + 1+2) atrophy, respectively. B, C, E, F, H and I showed the trends and differences in the sensitivity and specificity with total mucosal thickness change. AUC = area under the curve, ROC = receiver operating characteristic.

