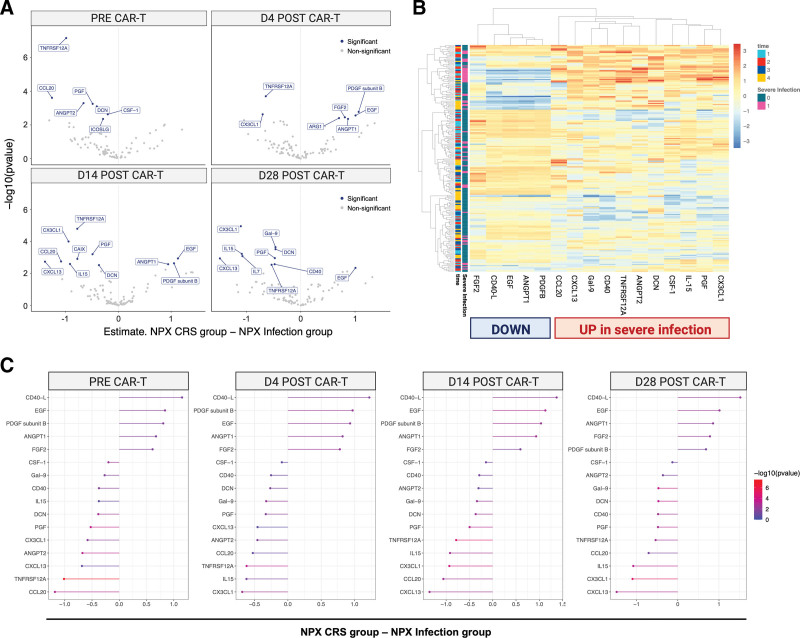
Figure 6.
Severe infections are associated with distinct inflammatory signatures compared with CRS only controls. (A) Volcano plots showing the estimated mean difference between infection and CRSonly patients (x-axis), and corresponding −log10 (P values) (y-axis). Colors indicate proteins that passed the multiple testing adjusted P value threshold of P < 0.05. Each panel corresponds to one timepoint (days 0, 4, 14, 28). (B) Heatmap depicting normalized and centered NPX values (color scale) of the 16 proteins that differed between infection and CRSonly patients (significant main and/or interaction effect). Each row corresponds to a sample, and each column to a protein. Both rows and columns are sorted by hierarchical clustering, with dendrograms showing the clustering result. Time and severe infection status are indicated by the leftmost columns. (C) Differential expression per timepoint (from left to right) of the 16 proteins that differed between infection and CRSonly patients (significant main and/or interaction effect). The x-axis depicts the estimated mean difference between infection and CRSonly patients, and colors indicate the corresponding P values (not corrected for multiple testing). Each panel corresponds to one timepoint, with proteins sorted by NPX level changes (right: downregulated; left: upregulated in the Infection group). CRS = cytokine release syndrome; NPX = Normalized Protein eXpression.

