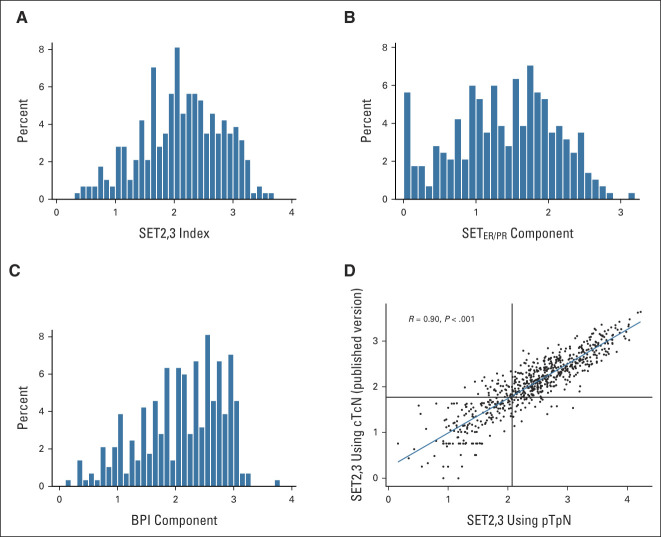
FIG A2.
(A) Distribution of SET2,3 scores across the entire cohort; median, 2.15; IQR, 1.65-2.64. (B) Distribution of the estrogen receptor/progesterone receptor component of SET2,3; SETER/PR median, 1.45; IQR, 0.92-1.92 and (C) the BPI component; median, 2.18; IQR, 1.64-2.67. (D) Independent calibration of SET2,3 indices in the diagnostic assay platform (Quantigene) with 807 tumor samples of hormone receptor–positive/human epidermal growth factor receptor 2–negative breast cancer: correlation of the SET2,3 index between using pT with pathologic number of pN and published version of SET2,3 using cT with cN. Black vertical line at 2.10 for pathologic SET2,3 and horizontal line at 1.77 for clinical SET2,3 indicate the threshold between high and low SET2,3. BPI, baseline prognostic index; cN, clinical node stage; cT, clinical tumor stage; IQR, interquartile range; pN, positive nodes; pT, pathologic tumor size; SET2,3, sensitivity to endocrine therapy index; SETER/PR, sensitivity to endocrine therapy index of transcription related to estrogen and progesterone receptors.

