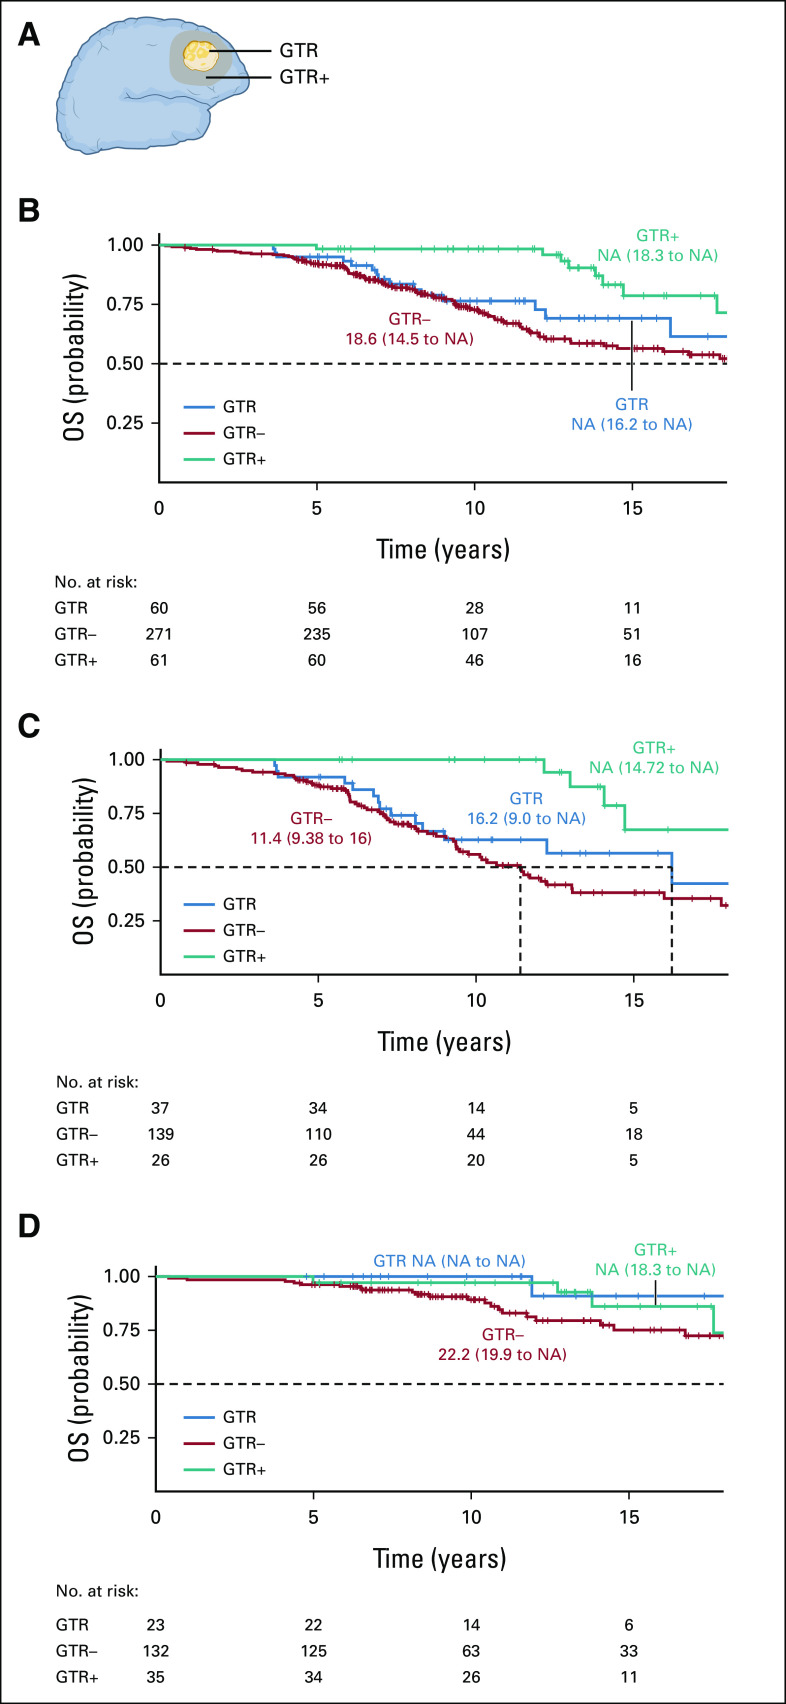
FIG 3.
GTR and GTR+ in the development cohort. (A) Schematic of GTR, GTR+ (resection beyond the imaging-defined tumor margin), and GTR– (resection ≤ 100%). (B) Kaplan-Meier curves for all OS UCSF patients stratified by GTR status. OS was longer in patients with GTR+ (P < .001 by Tarone-Ware test). (C) Kaplan-Meier curves stratified by GTR status in UCSF patients with astrocytoma (P < .001 by Tarone-Ware test). (D) Kaplan-Meier curves stratified by GTR status in UCSF patients with oligodendroglioma (P = .11 by Tarone-Ware test). GTR, gross total resection; NA, not available; OS, overall survival; UCSF, University of California, San Francisco.

